LSE Table and Figure
See Sample LSE Table
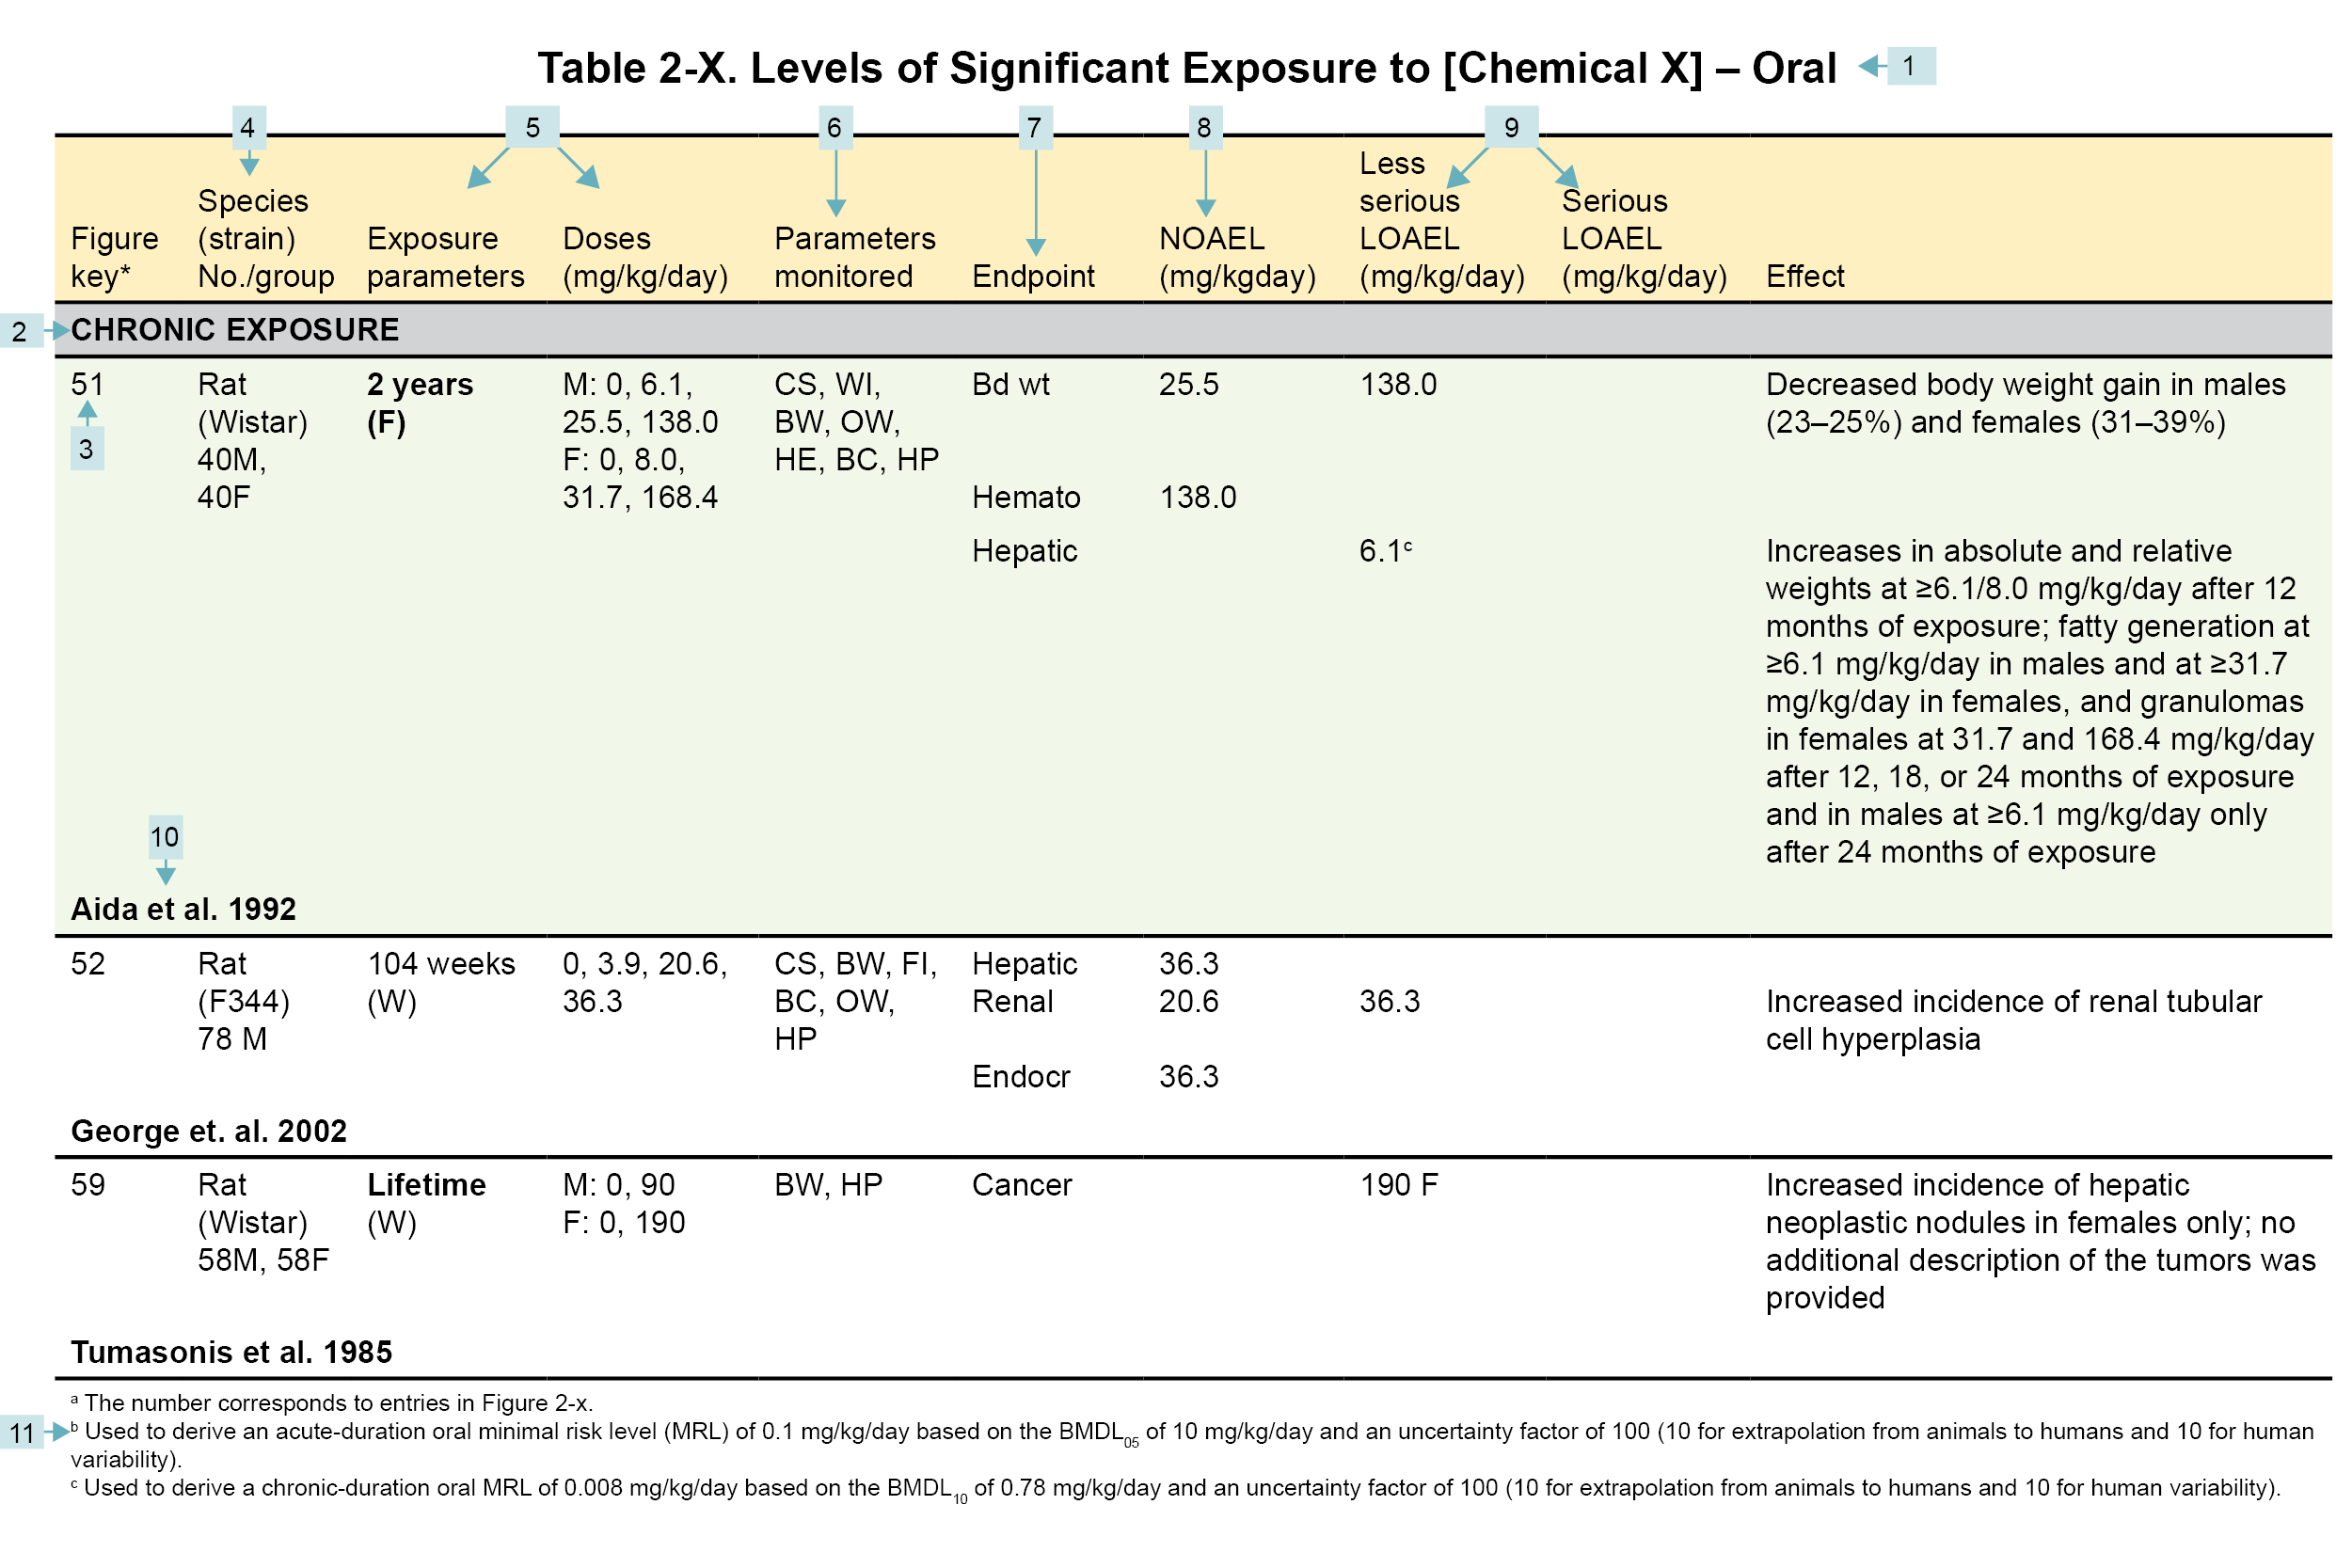
Table Legend
(1) Route of exposure. Typically, LSE tables present data on each of the three principal exposure routes (i.e., inhalation, oral, and dermal). LSE figures are limited to the inhalation and oral routes. Not all substances will have data on each route of exposure. Profiles with more than one chemical can have more LSE tables and figures.
(2) Exposure period. Three exposure periods—acute (<15 days), intermediate (15–364 days), and chronic (≥365 days)—are presented within each relevant exposure route. In this example, two oral studies of chronic-duration exposure are reported. For quick reference to health effects occurring from a known length of exposure, locate the applicable exposure period within the LSE table and figure.
(3) Figure key. Each key number links study information to one or more data points (using the same key number) in the corresponding LSE figure. In this example, key number 51 represents a study that identified NOAELs and less serious LOAELs (also see the three “51R” data points in sample LSE figure).
(4) Species (strain) No./group. This column identifies the animal or human test species (and strain), number of subjects, and sex per group. In the Toxicological Profile, the Relevance to Public Health chapter covers the relevance of animal data to human toxicity and the Toxicokinetics section contains any available information on comparative toxicokinetics. Although NOAELs and LOAELs are species-specific, the levels are extrapolated to equivalent human doses to derive an MRL.
(5) Exposure parameters/doses. These columns provide the study duration and exposure regimens, which permits comparison of NOAELs and LOAELs from different studies. In this case (key number 51), rats were orally exposed to “Chemical X” via feed for 2 years. This will indicate if readers should refer to an original reference paper for a more complete review of the dosing regimen.
(6) Parameters monitored. This column lists the parameters used to assess health effects, which could include serum (blood) chemistry (BC), behavioral (BH), biochemical changes (BI), body weight (BW), clinical signs (CS), developmental toxicity (DX), enzyme activity (EA), food intake (FI), fetal toxicity (FX), gross necropsy (GN), hematology (HE), histopathology (HP), lethality (LE), maternal toxicity (MX), organ function (OF), ophthalmology (OP), organ weight (OW), teratogenicity (TG), urinalysis (UR), and water intake (WI).
(7) Endpoint. This column lists the endpoints examined. The major categories included are death, body weight, respiratory, cardiovascular, gastrointestinal, hematological, musculoskeletal, hepatic, renal, dermal, ocular, endocrine, immunological, neurological, reproductive, developmental, other noncancer, and cancer. “Other non-cancer” refers to any effect not covered in these systems. In the example of key number 51, three endpoints (body weight, hematological, and hepatic) were investigated.
(8) NOAEL. The body weight effect reported in key number 51 is a NOAEL at 25.5 mg/kg/day. NOAELs are not reported for cancer and death; except for these two endpoints, this field is left blank if the study did not identify a NOAEL.
(9) LOAEL. LOAELs are classified into “Less Serious” and “Serious” categories to help readers identify the exposure levels at which adverse health effects first appear and the gradation of effects with increasing dose. Accompanying the LOAEL is a brief description of the specific endpoint used to quantify the adverse effect. CELs are always considered serious effects. If the study does not identify LOAEL/CEL values, this field is left blank. In this example, key number 51 reports a less serious LOAEL of 6.1 mg/kg/day for the hepatic system, which was used to derive a chronic exposure, oral MRL of 0.008 mg/kg/day (see footnote “c”). MRLs are not derived from serious LOAELs.
(10) Reference. An abbreviated reference is provided (full references are available in the References section in the Toxicological Profiles).
(11) Footnotes. Any explanations of abbreviations or reference notes for data in the LSE tables are found here. For example, footnote “c” indicates that the LOAEL of 6.1 mg/kg/day in key number 51 was used to derive an oral MRL of 0.008 mg/kg/day.
See Sample LSE Figure
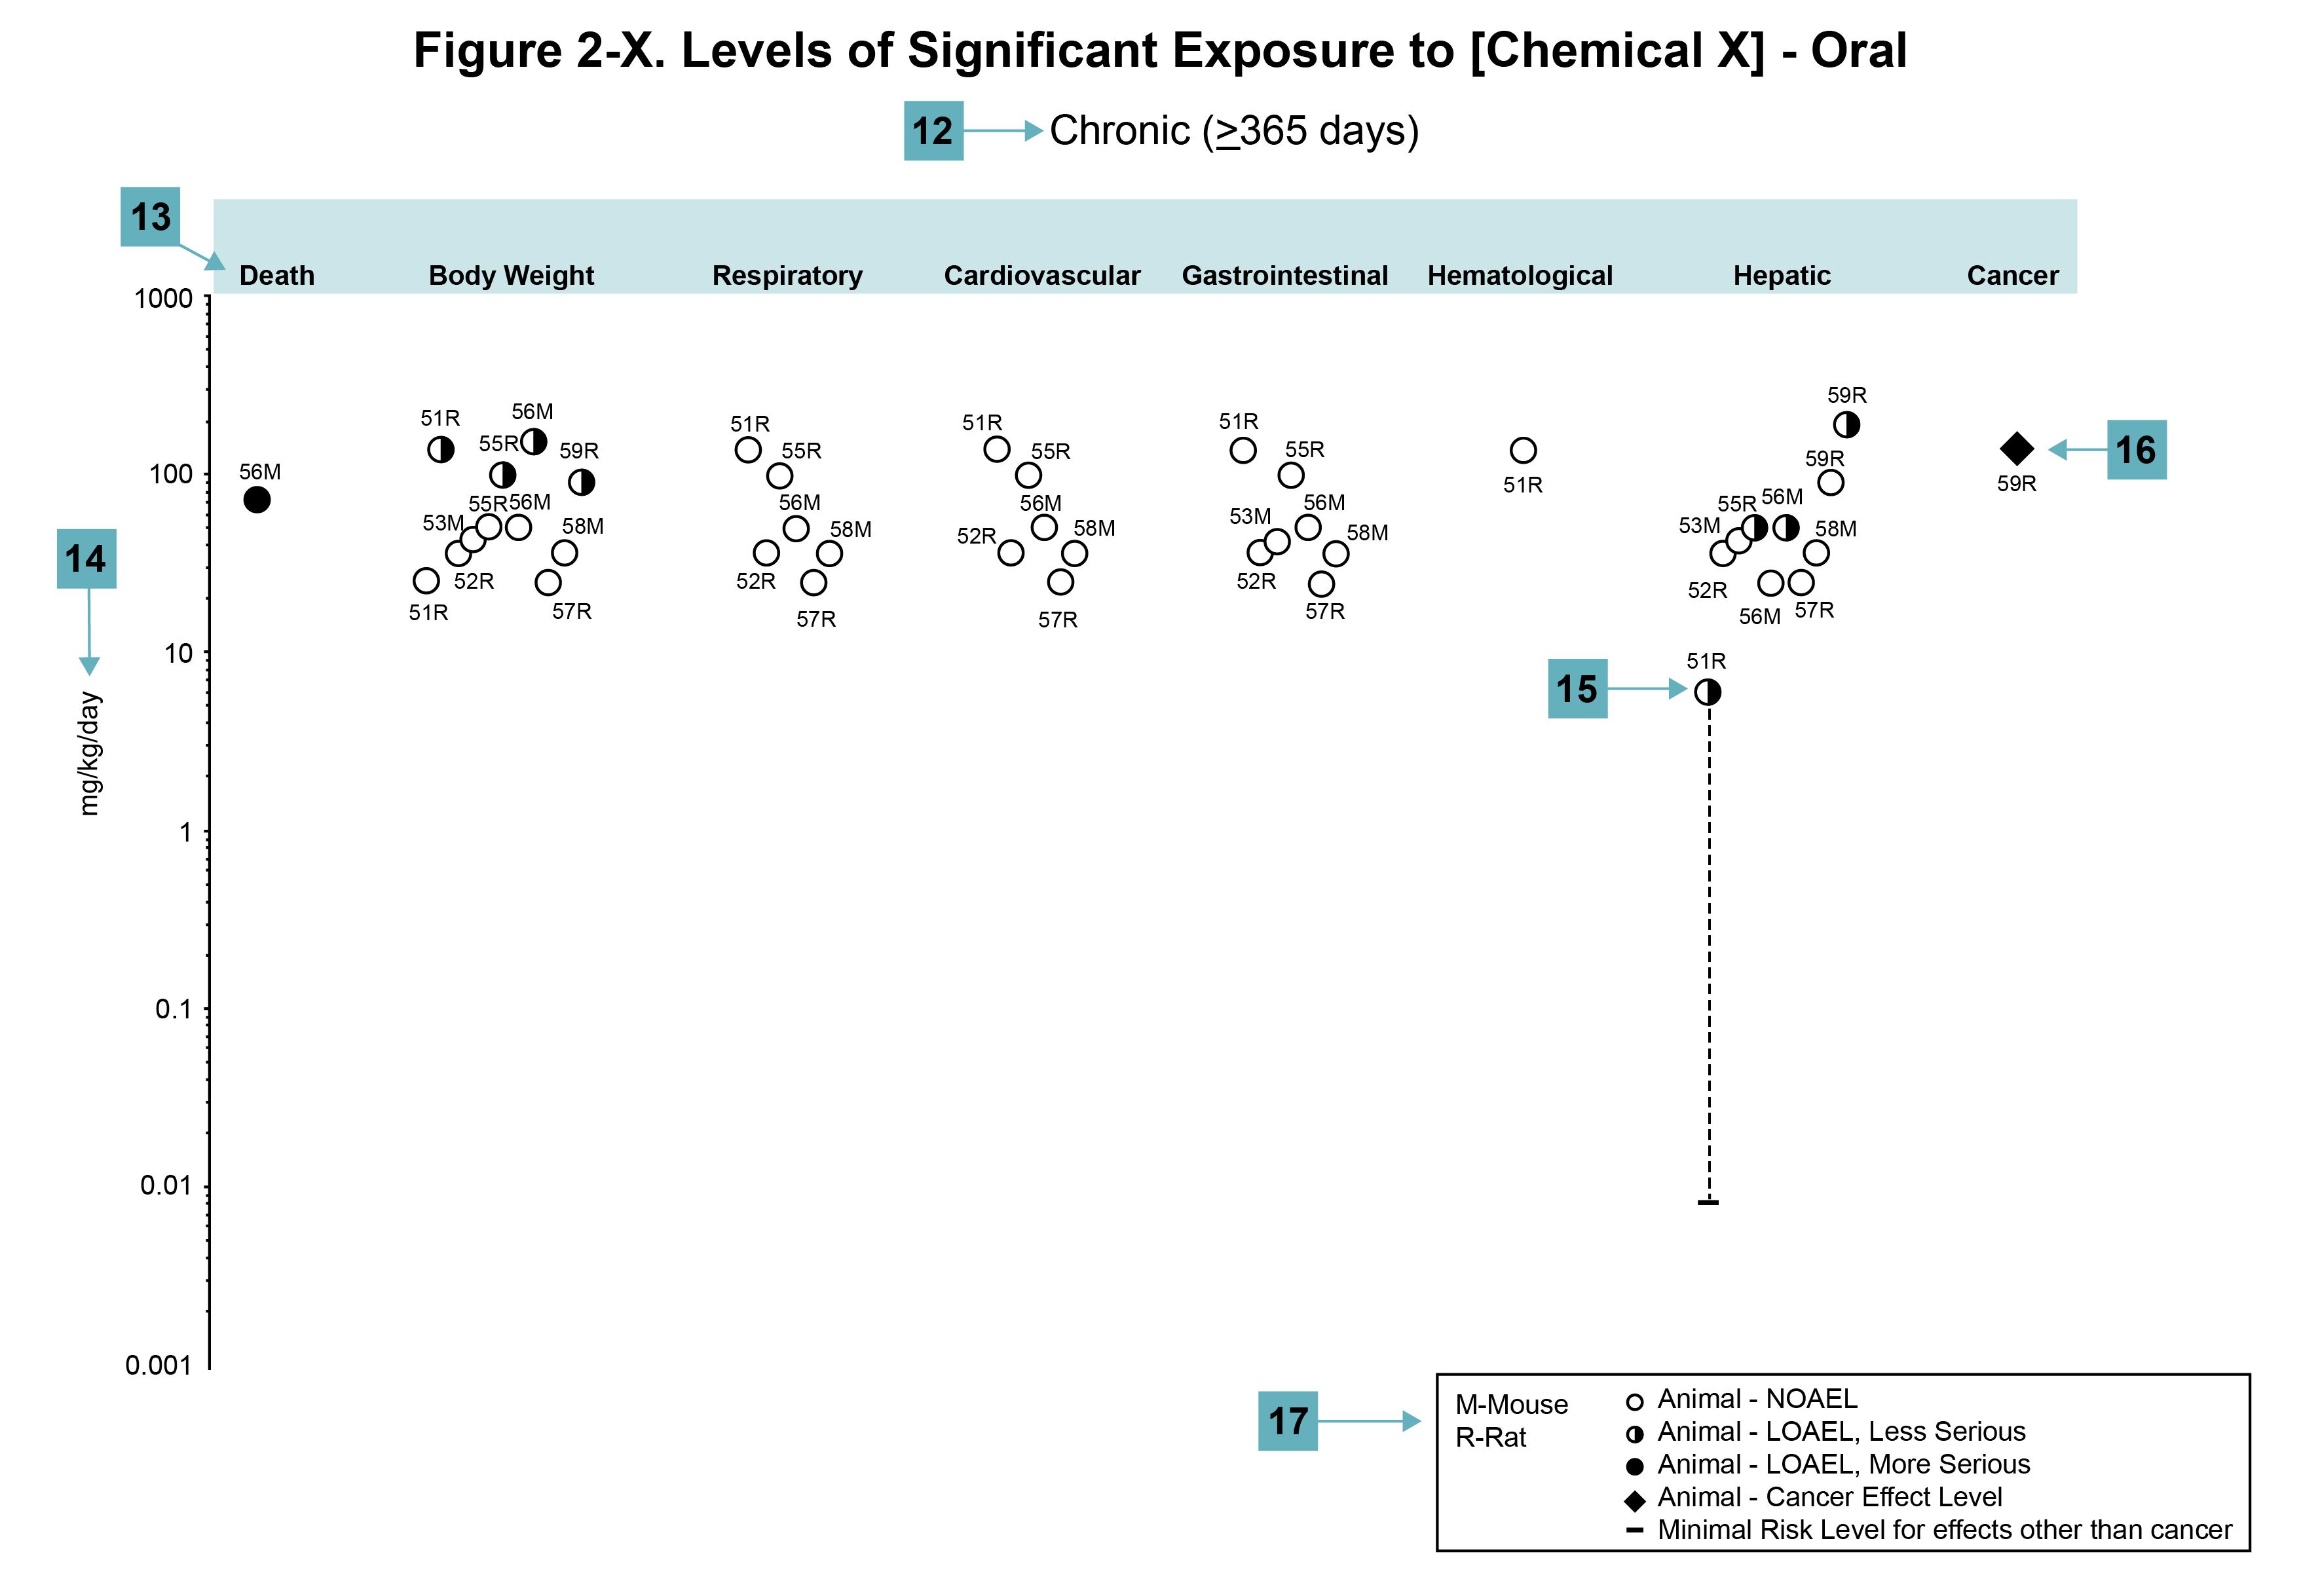
Figure Legend
(12) Exposure period. The same exposure periods appear as in the LSE table. This example illustrates health effects observed within the chronic exposure period.
(13) Endpoint. These are the categories of health effects for which reliable quantitative data exist. The same health effect endpoints appear in the LSE table.
(14) Levels of exposure. Concentrations or doses for each health effect in the LSE tables are graphically displayed in the LSE figures. Exposure concentration or dose is measured on the log scale “y” axis. Inhalation exposure is reported in mg/m3 or ppm, and oral exposure is reported in mg/kg/day.
(15) LOAEL. In this example, the half-shaded circle designated 51R identifies a LOAEL critical endpoint in the rat upon which a chronic oral exposure MRL is based. The key number 51 corresponds to the entry in the LSE table. The dashed descending arrow indicates the extrapolation from the exposure level of 6.1 mg/kg/day (see entry 51 in the sample LSE table) to the MRL of 0.008 mg/kg/day (see footnote “c” in the sample LSE table).
(16) CEL. Key number 59R is one of studies for which CELs were derived. The diamond symbol refers to a CEL for the test species (rat). The number 59 corresponds to the entry in the LSE table.
(17) Key to LSE figure. The key provides the abbreviations and symbols used in the figure.