Tips for Conducting the Exposure Pathway Evaluation
To evaluate the exposure pathways at a hazardous waste site systematically, follow these tips:
Be site-specific. Consider site-related factors that may enhance, prevent, or modify possible exposures to site-related contaminants. For example, if a physical barrier (such as a fence) at a site is not well maintained, consider the possible exposure pathways and provide recommendations for improving controls to prevent exposure.
Be realistic. Consider realistic exposure pathway scenarios based on the community’s characteristics and activities. For example, investigate whether the community engages in recreational activities on or near the contaminated site, such as at fields, parks, and beaches.
Be comprehensive. Evaluate all past, present, and potential future exposed populations and the extent of exposures via different exposure pathways. In addition to analyzing data in site investigation reports, consider other sources of information such as anecdotal information from community members.
Tip: Keep in mind that sometimes health assessors can have information on exposure pathways, but EPA has not identified the source. Also, you might sometimes determine that an exposure is not site-related, but still decide to evaluate it or work with other agencies to address the exposure.
Be precise and clear. Be precise and clear when defining and analyzing each of the five potential exposure pathway elements. Be very specific in defining who has been, is, or could be exposed so that estimates of exposure can be site-specific and appropriate for the subject population.
Develop a site conceptual model. Health assessors have different ways of evaluating exposure pathways at their sites, but a common and beneficial approach is to develop a site conceptual model. A site conceptual model helps visualize (using a schematic or diagram) how contaminants move in the environment at your site and how people might come into contact with these contaminants. For example, consider a closed landfill site with homes immediately adjacent to the landfill. Such sites usually produce some level of both groundwater and soil gas contaminants. If information collected early in the process indicates that the municipal water supply for homes is from a reservoir located many miles away, then researching the groundwater contamination pathway is clearly not a priority. If, on the other hand, on-site soil gas measurements indicate methane concentrations many times above the explosive limit, the migration of flammable gases into homes would require immediate investigation. Therefore, by developing a site conceptual model early in the process, and by periodically revisiting this model, you can address the most critical public health issues in a timely manner.
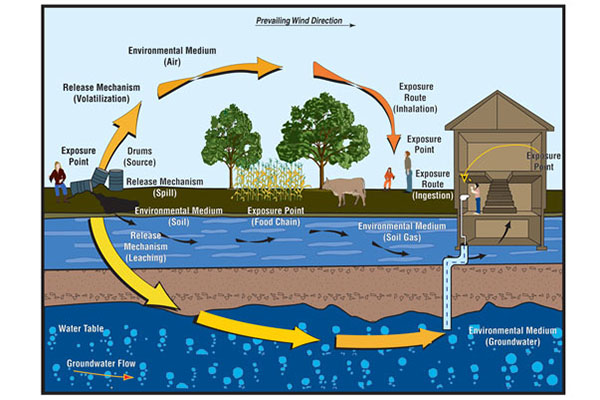
For image description, click here.
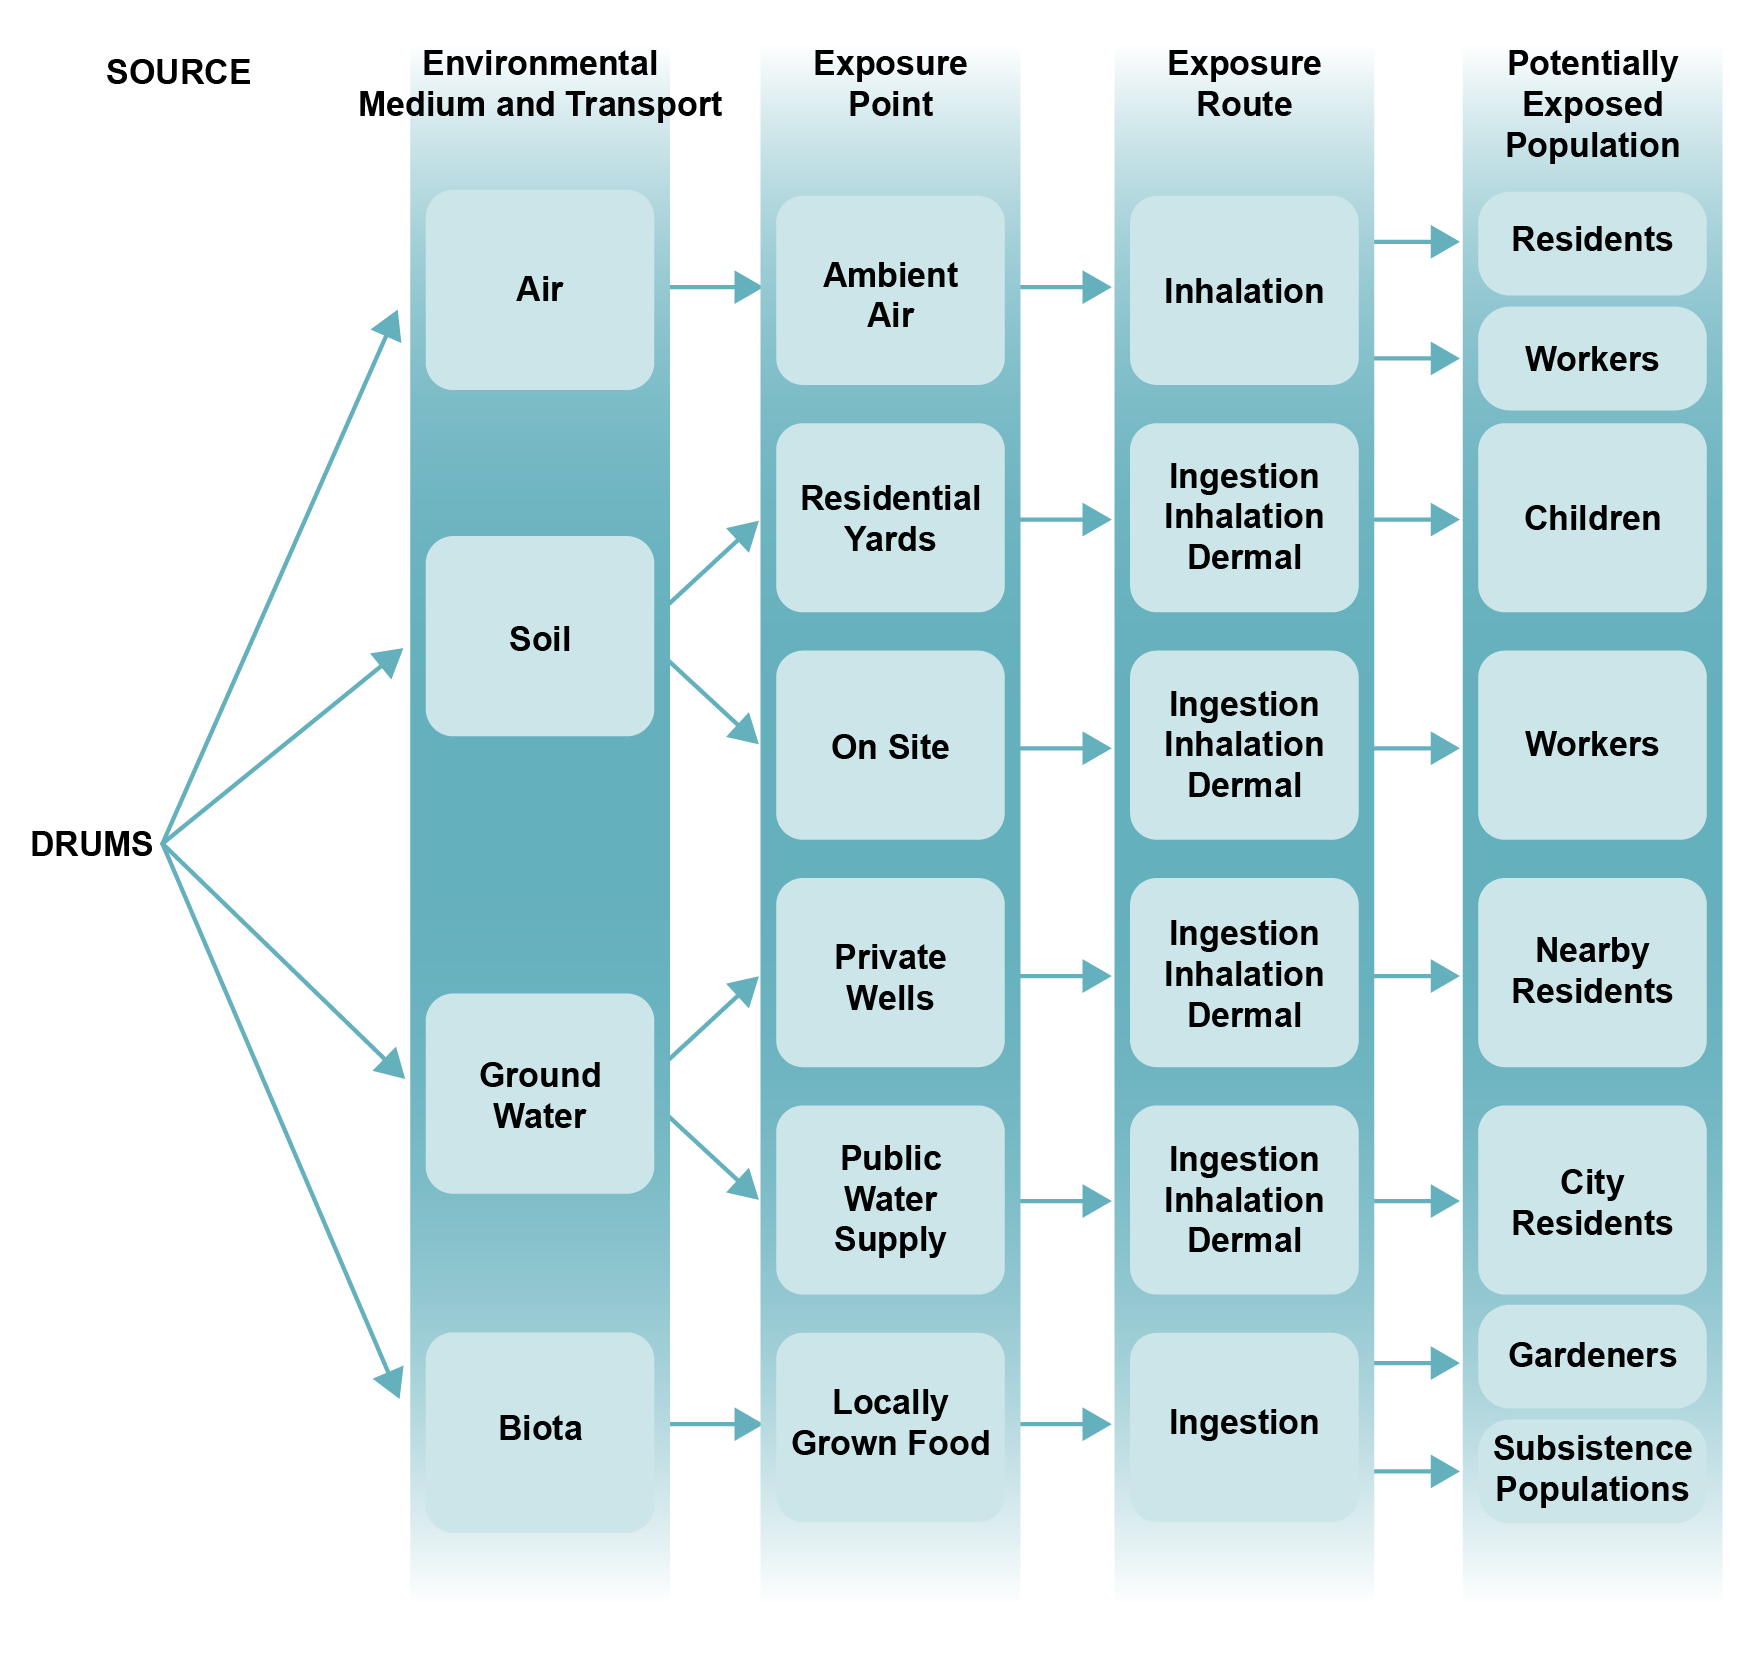
For image description, click here.
This diagram shows another approach for depicting a site conceptual model for a pile of drums. It more explicitly outlines the five components you should consider when analyzing the exposure pathways at your site: 1) contaminant source, 2) environmental media transporting contaminants from the source to exposure points, 3) exposure points, 4) exposure routes, and 5) potentially exposed population(s).
Develop a site timeline. Identify important past and current occurrences, as well as those that could happen in the future, to help categorize completed, potential, or eliminated pathways. The following are examples of events to document:
- Current and past activities conducted at a site including hazardous waste treatment, storage, and disposal practices.
- Dates of specific site operations during which contaminant releases might have occurred.
- Any significant events in the site’s history (such as changes in the site’s size, boundaries, site ownership, and industrial practices) that could affect the types, rates, and times of contaminant releases.
- Any information about the past, current, and future regulatory status of the site that could indicate the magnitude of contaminant use over time.
- Actions taken by EPA, state agencies, and site operators to address releases of contaminants from the site to mitigate and eliminate exposures.
- Information about permits (air, water discharge, hazardous waste), monitoring data, documented discharges over time, and compliance data.
Complete an exposure pathway table. In addition to text discussions, document and summarize the exposure pathway evaluation information and results in an exposure pathways table. You must include an exposure pathways table in your documents unless you are evaluating just one pathway. See the table below, which represents just one example of how you create a completed table. This example is a very simple sample to show what a completed table could look like, using just a few of the possible exposures from the previously illustrated scenario. As shown, for each exposure pathway, the table indicates the contaminant source, environmental fate and transport (environmental media involved), exposure points, exposure routes, and potentially exposed populations. The table also shows the conclusion category (completed, potential, or eliminated) for each time period for each individual pathway.
The estimated numbers of people exposed via each pathway should be specified as well, but this is often done in demographic maps. For your tables, adding an extra column or row for notes can help the audience understand more about why a pathway has a certain category (e.g., a pathway categorized as eliminated because of actions taken to remove the contamination or exposure point). Also refer to ATSDR’s PHAT Module 4 (this link will take you to the module’s registration page in CDC TRAIN) for more example exposure pathway tables, which are specific to that module’s case study and case exercise scenarios.
Example Table: Documenting Exposure Pathways
| Pathway Name | Elements of an Exposure Pathway | Time Frame | Pathway Conclusion Category (one for each time frame) | ||||
|---|---|---|---|---|---|---|---|
| Contaminant Source | Environmental Fate and Transport | Exposure Point | Exposure Route | Potentially Exposed Population | |||
| Off-site air | Drums | Air | Ambient air | Inhalation | Residents | Past | Completed Potential Eliminated |
| Current | Completed Potential Eliminated |
||||||
| Future | Completed Potential Eliminated |
||||||
| Off-site residential gardens | Drums | Biota | Locally grown food | Ingestion | Residents with gardens | Past | Completed Potential Eliminated |
| Current | Completed Potential Eliminated |
||||||
| Future | Completed Potential Eliminated |
||||||

Use an exposure pathways checklist [PDF – 100 KB] to evaluate all possible exposure pathways and determine those that apply to your site.