Screening Analysis Example
See the steps of the screening analysis applied to a simple fictitious example.
The following example includes fictitious data created to illustrate the screening analysis process using one conservative screen. All ATSDR CVs were current when the example was developed. Health assessors must always use the most current ATSDR CVs and non-ATSDR screening levels available.
Note: All screening level information contained in this section was current when this e-manual was first developed. Always seek the most current screening levels available at the time of your evaluation.
Site background: A nursing home is located adjacent to a former dry-cleaning facility. Soil gas and groundwater sampling measurements indicated there is a potential for vapor intrusion into the nursing home, and indoor air samples were collected in response. Sampling was conducted to examine the possible presence of three particular contaminants in indoor air: tetrachloroethylene, trichloroethylene, and trans-1,2-dichloroethylene.
Sampling data: Eight air samples were collected inside the nursing home building. Results were reported in parts per billion (ppb), and the laboratory detection limit was 0.05 ppb for tetrachloroethylene and 0.75 ppb for the other contaminants.
Note: This example was simplified for illustrative purposes. The example is assuming there are enough air samples that are representative of both temporal and spatial conditions.
Air Sampling Data (Collected in March)
Contaminants |
Sample 1 (ppb) |
Sample 2 (ppb) |
Sample 3 (ppb) |
Sample 4 (ppb) |
|---|---|---|---|---|
| Tetrachloroethylene | 0.20 | 0.30 | 0.40 | 0.50 |
| Trichloroethylene | 1 | 2 | 4 | 10 |
| Trans-1,2-dichloroethylene | U | U | U | U |
ppb = parts per billion
U = not detected above the detection limit of 0.75 ppb
Air Sampling Data (Collected in July)
Contaminants |
Sample 1 (ppb) |
Sample 2 (ppb) |
Sample 3 (ppb) |
Sample 4 (ppb) |
|---|---|---|---|---|
| Tetrachloroethylene | 0.40 | 0.20 | 0.10 | 0.10 |
| Trichloroethylene | 8 | 4 | 5 | 4 |
| Trans-1,2-dichloroethylene | U | U | U | U |
ppb = parts per billion
U = not detected above the detection limit of 0.75 ppb
Step 2: Identify Contaminants and Concentrations
Now, looking at the available sampling data from Step 1, identify each detected contaminant and its corresponding maximum concentration for screening (as noted, there are some exceptions to using the maximum for some air evaluations during this step). The table below shows the maximum concentrations detected among the eight samples. Both maximum concentrations were detected in Sample 4 from the March sampling event.
ppb = parts per billion
* ATSDR recommended CV
CREG = cancer risk evaluation guide
CV = comparison value
EMEG = environmental media evaluation guide
Int = intermediate
NA = not available
ppb = parts per billion
RMEG = reference dose media evaluation guide
Step 4: Conduct the Comparison and Identify Contaminants Requiring Further Evaluation
Now, you will compare the maximum concentrations identified in Step 2 with the recommended ATSDR CVs identified in Step 3. The table below shows the comparison.
The maximum concentration of 10 ppb for trichloroethylene exceeds the CREG of 0.040 ppb, so trichloroethylene will be retained for further evaluation. Note that the maximum concentration of trichloroethylene also exceeds the available EMEGs (chronic and intermediate) and the RMEG. Therefore, even though for screening purposes you are retaining the CREG (i.e., ATSDR’s CV for cancer effects), both cancer and non-cancer effects need to be evaluated in the next scientific component: the EPCs and Exposure Calculations Evaluation.
The maximum concentration of tetrachloroethylene is below its CV, so this is not retained (but refer to Step 5, which discusses other factors to consider).
Contaminants |
Maximum Concentrations |
Recommended ATSDR CVs |
Type of ATSDR CVs |
Does Maximum Meet
|
Retain for Further Evaluation? |
|---|---|---|---|---|---|
| Tetrachloroethylene | 0.50 ppb | 0.57 ppb | CREG | No | No |
| Trichloroethylene | 10 ppb | 0.040 ppb | CREG | Yes | Yes |
CREG = cancer risk evaluation guide
ppb = parts per billion
CV = comparison value
CV PHAST Module Tables for the Example Scenario
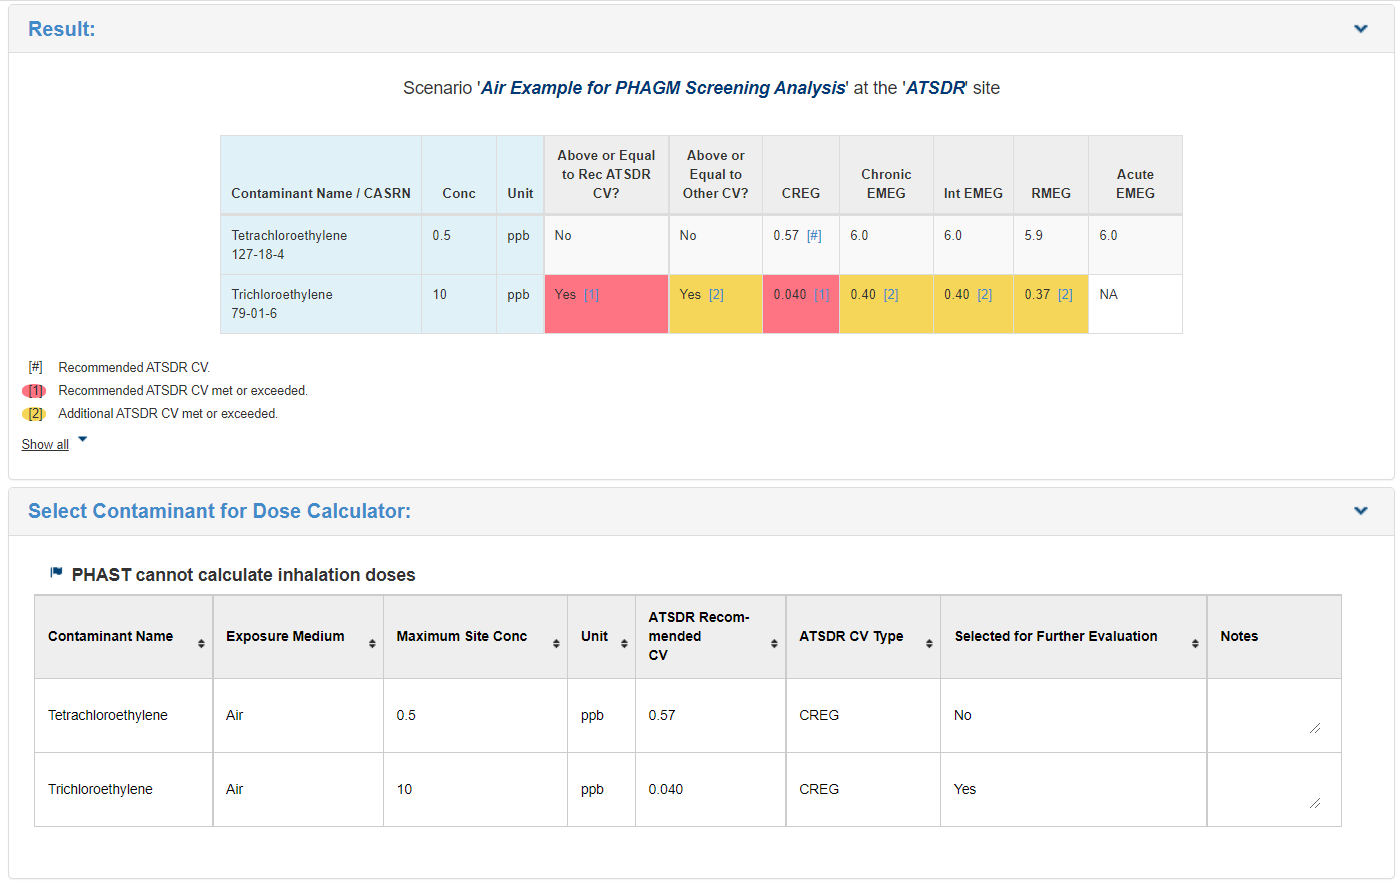
CASRN = Chemical Abstracts Service Registry Number
Conc = concentration
CREG = cancer risk evaluation guide
CV = comparison value
EMEG = environmental media evaluation guide
Int = intermediate
NA = not available
ppb = parts per billion
RMEG = reference dose media evaluation guide
The CV Module in PHAST would provide users with these onscreen tables for the example scenario.
Step 5: Check for Factors Warranting Further Evaluation
The last step of the process is to check for other factors that might warrant further evaluation. In this example, you would check if tetrachloroethylene (below its CV) represented a community concern, and if so, you might retain it for further evaluation. You would also compare the detection limit of 0.75 ppb for trans-1,2-dichloroethylene (examined in Step 1), which was not detected, to ATSDR CVs. The table below shows the results. As shown, the detection limit for trans-1,2-dichloroethylene was below the CVs, so a health assessor could eliminate it from further evaluation.
Comparison of Recommended CV for Trans-1,2-Dichloroethylene to Its Detection Limit
Contaminant |
Detection Limit |
ATSDR Air CVs (in ppb) |
||||
|---|---|---|---|---|---|---|
CREG |
Chronic EMEG |
Int EMEG |
RMEG |
Acute EMEG |
||
| Trans-1,2-dichloroethylene | 0.75 ppb | NA | NA | 200 | NA | 200 |
CREG = cancer risk evaluation guide
CV = comparison value
EMEG = environmental media evaluation guide
Int = intermediate
NA = not available
ppb = parts per billion
Overall Findings
Using the information from this example for Steps 1 through Step 5, one contaminant, trichloroethylene, requires further evaluation. That means you would carry it through to the next phase of the scientific evaluation: the EPCs and Exposure Calculations Evaluation. You will also, summarize the screening analysis process in your documents.