Process and Decision Logic in ATSDR’s Screening Analysis
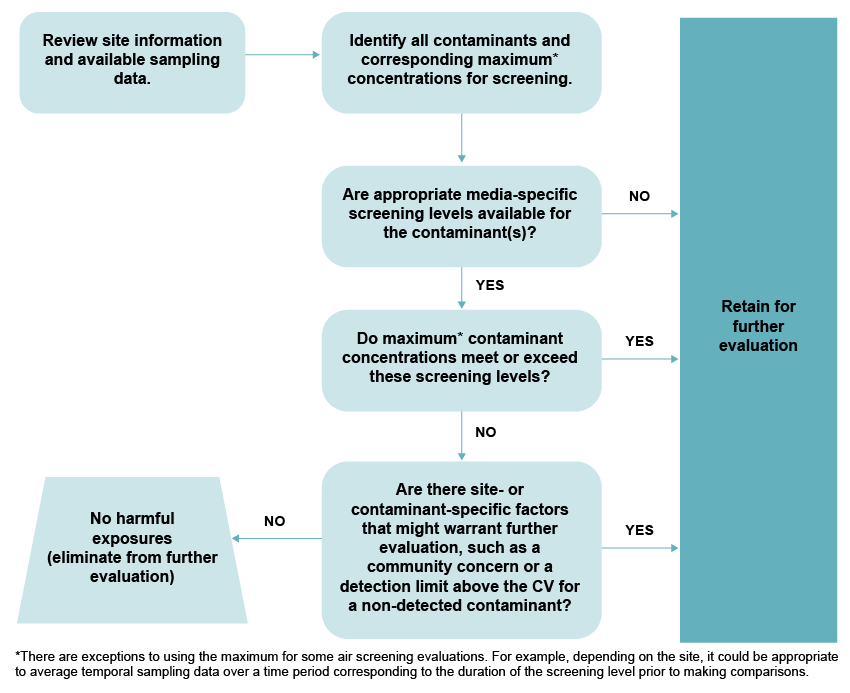
This flow chart presents the process and decision logic for ATSDR’s screening analysis.
First, review site information and available sampling data. Then, identify all contaminants and corresponding maximum concentrations for screening. Note: Using the maximum for screening is presented in this flow chart. There are exceptions to using the maximum for some air screening evaluations. For example, depending on the site, it could be appropriate to average temporal sampling data over a time period corresponding to the duration of the screening level prior to making comparisons.
Next you will ask: Are appropriate media-specific screening levels available for the contaminant(s)? If no, retain for further evaluation. If yes, ask: do maximum contaminant concentrations meet or exceed these screening levels? If yes, retain for further evaluation. If no, ask: Are there site- or contaminant-specific factors that might warrant further evaluation, such as a community concern or a detection limit above the CV for a non-detected contaminant? If yes, retain for further evaluation. If no, then no harmful exposures are present; you can eliminate from further evaluation.