Initial and Refined Screening
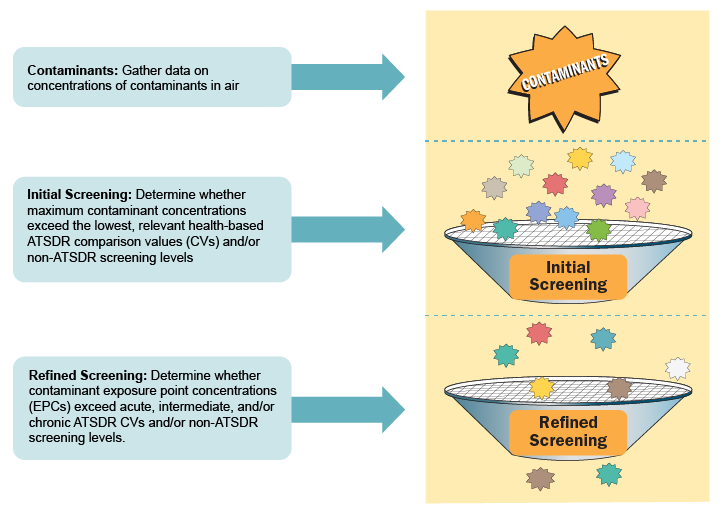
This flow chart shows the initial and refined screening process that could be used for some air evaluations. The chart shows three text boxes on the left with arrows corresponding to images on the right. The first text box says, “Contaminants: gather data on concentrations of contaminants in air.” The arrow from this box points to a star with the word contaminants inside. This is showing that the star represents “contaminants” throughout the illustration. The next text box says, “Initial Screening: Determine whether maximum contaminant concentrations exceed the lowest relevant health-based ATSDR comparison values (CVs) and/or non-ATSDR screening levels.” An arrow points from this box to multiple (13) different stars representing contaminants going into a mesh strainer labeled “Initial Screening.” The next text box says, “Refined Screening: Determine whether contaminant exposure point concentrations (EPCs) exceed acute, intermediate, and/or chronic ATSDR CVs and/or non-ATSDR screening levels.” An arrow points from this box to another mesh strainer labeled “Refined Screening.” This image shows fewer contaminants (six) remaining after going through the Initial Screening, which are then filtered through the strainer during the Refined Screening. The image shows that two contaminants filtered through the strainer and remained after the Refined Screening.