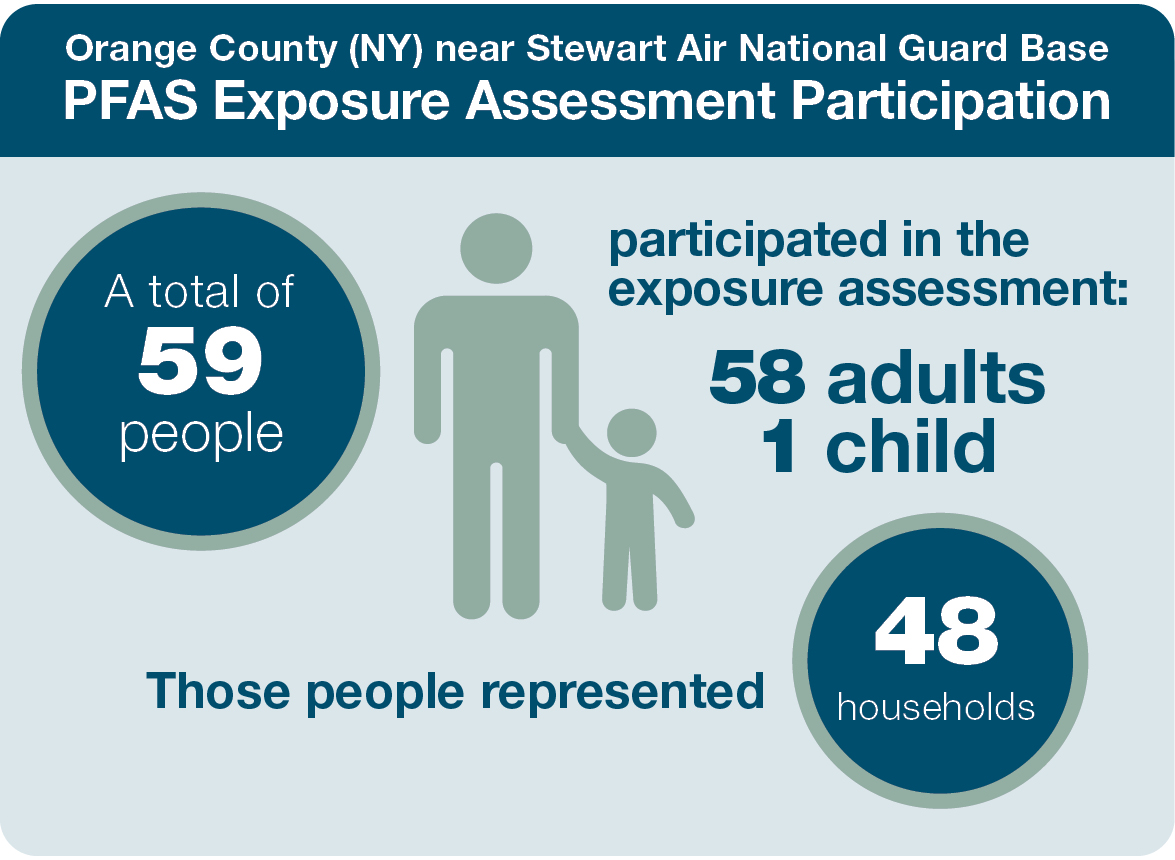
At a glance
In 2019, the Centers for Disease Control and Prevention (CDC) and the Agency for Toxic Substances and Disease Registry (ATSDR) started exposure assessments (EAs) in communities near current or former military bases known to have had per- and polyfluoroalkyl substances (PFAS) in their drinking water. Individuals who participated in the EAs provided blood and urine samples to CDC/ATSDR for analysis. We sent letters with lab results to the participants.

Information to protect our communities
In addition to testing participants' blood and urine samples, ATSDR is reviewing information like age and location. This helps us to better understand the community's exposure. Once our full analysis is complete, CDC/ATSDR will host a community meeting to share our findings and recommendations.

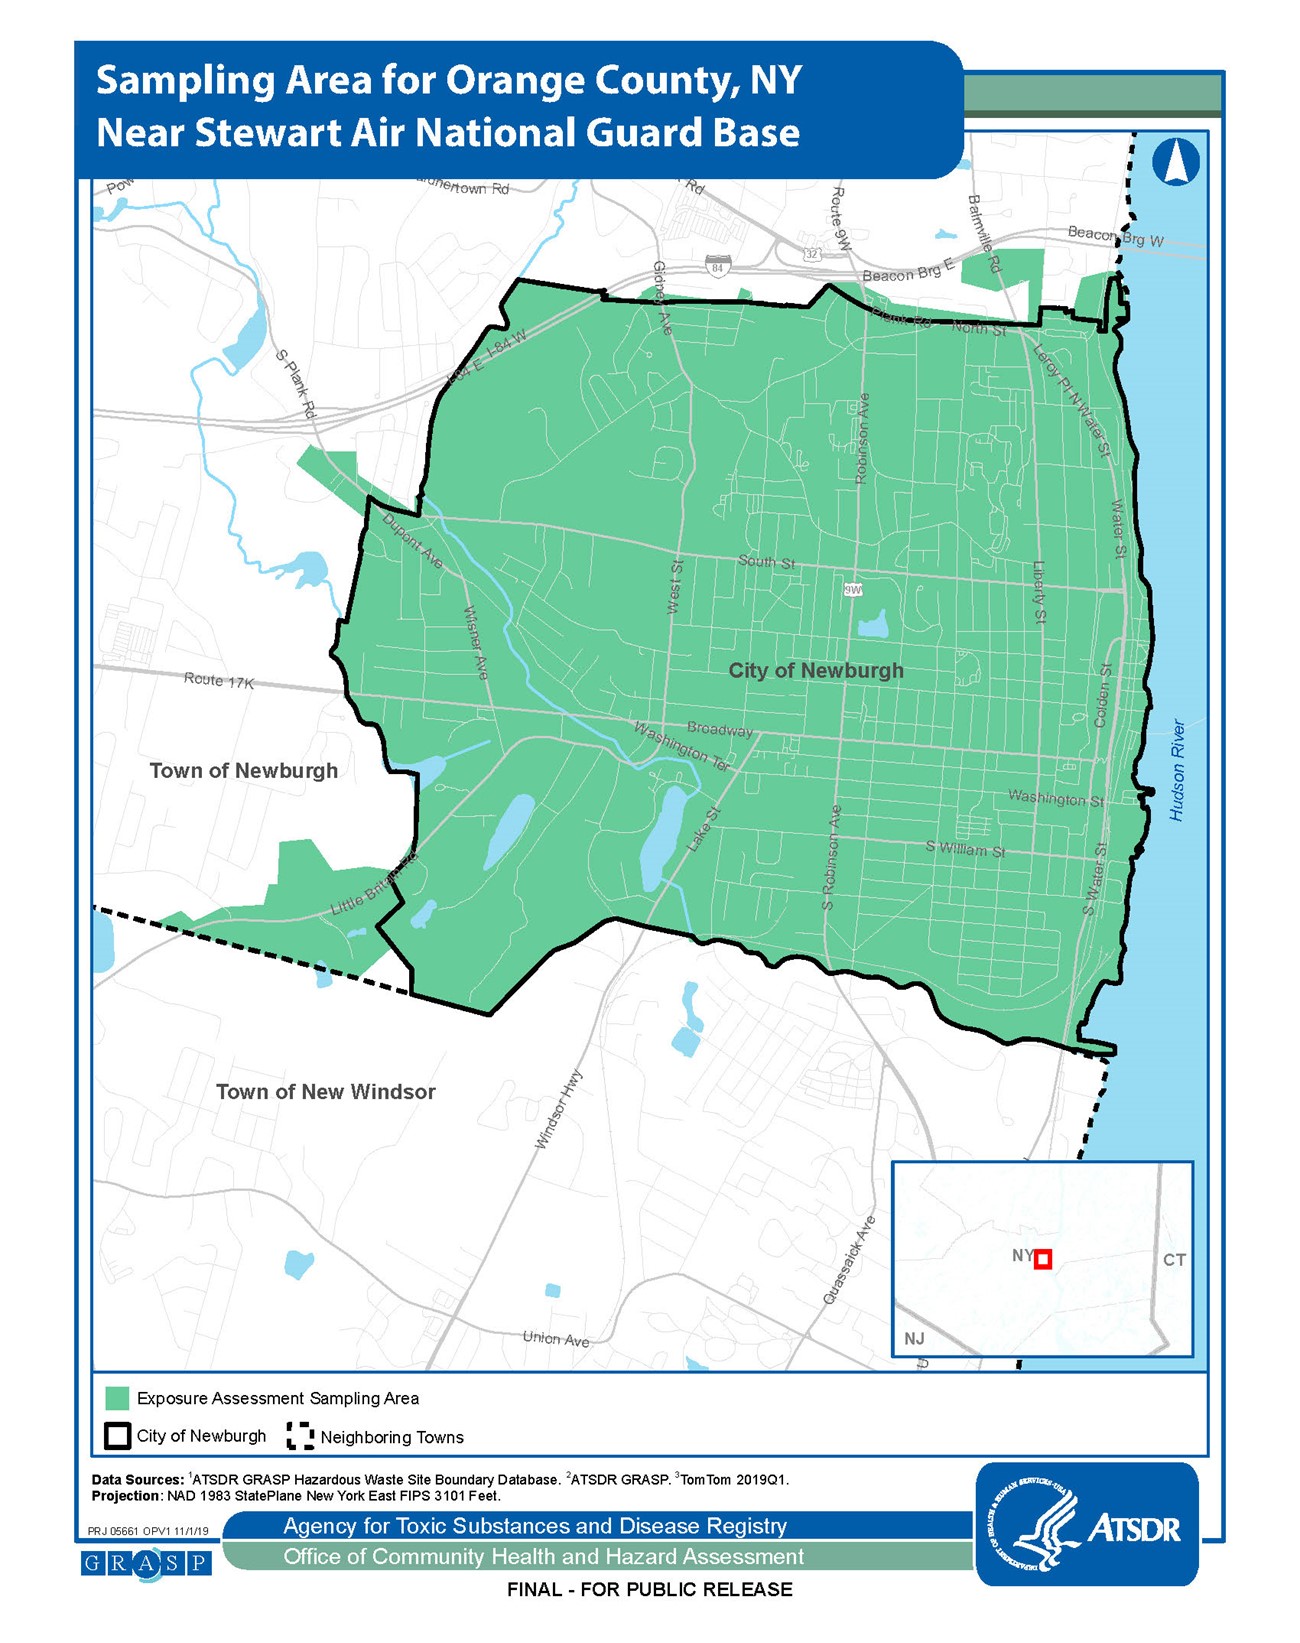
The assessment focused on Orange County, NY, near the Stewart Air National Guard Base (ANGB). For more information, refer to the map of the sampling area.

PFAS levels in blood
Did you know?
The lab tested participants' blood for seven different PFAS. PFAS levels are measured in micrograms per liter (μg /L).
CDC/ATSDR compared levels of PFAS in participants' blood across the community to the levels found in the U.S. population. Three PFAS (PFHxS, PFOS, and PFOA) were detected above national averages. The levels of PFNA, MeFOSAA, PFUnA, and PFDA were similar to or below national averages.
PFAS levels in blood compared to other studies**


PFAS levels in urine
All participants provided a urine sample. Only a subset was analyzed because the laboratory method to detect PFAS in urine is still being refined.
PFAS were not found in the urine samples analyzed by the laboratory. Therefore, ATSDR did not analyze the rest of the urine samples for PFAS. The average levels of PFAS in urine could not be detected due to the small number of samples where PFAS were found.
PFAS levels in tap water and dust
CDC/ATSDR planned to collect tap water and dust samples from some participating households in Orange County in fall 2020. Due to the COVID-19 pandemic, ATSDR had to postpone these efforts. ATSDR collected the samples in the City of Newburgh, Orange County (NY) in 2021:
- Five households participating in the EA will be selected at random.
- They will be invited by phone call to participate in the sampling.
- The results will be shared with household members once available.
The analysis of the environmental results will be included with or added to the Orange County PFAS EA report.
Local authorities in the City of Newburgh have taken action to reduce levels of PFAS in drinking water. Based on the information ATSDR has reviewed, the public drinking water supply in the City of Newburgh currently meets all federal guidelines and New York State standards for PFAS. ATSDR does not recommend community members use alternative sources of water.
About the results
For more information
Visit www.atsdr.cdc.gov/pfas, or contact:
Luis Rivera-Gonzalez, PhD | Region 2 Toxicologist
lqx8@cdc.gov | (732) 906-6933
CDC/ATSDR is evaluating data collected from the PFAS EA to better understand exposure in the community. The PFAS EA measures PFAS levels in people's bodies but is not able to identify health effects associated with these levels of exposure. We are working to better understand health effects from PFAS exposure through the Multi-site Health Study.
We are also reaching out to doctors, nurses, and other health care providers in your area to provide PFAS information.
- https://www.tandfoline.com/doi/pdf/10.1080/15426110308984859?needAccess=true
- CDC/ATSDR data collection completed in 2020
- https://www.atsdr.cdc.gov/HAC/pha/Decatur/Perfluorochemical_Serum%20Sampling.pdf
- https://www.cdc.gov/exposurereport/pdf/FourthReport_UpdatedTables_Volume1_Jan2019-508.pdf
- https://ehp.niehs.nih.gov/doi/pdf/10.1289/ehp.0800379
- https://health.pa.gov/topics/Documents/Environmental%20Health/PEATT%20Pilot%20Project%20Final%20Report%20April%2029%202019.pdf
- https://dhhs.nh.gov/dphs/documents/pease-pfc-blood-testing.pdf
- https://www.health.ny.gov/environmental/investigations/drinkingwaterresponse/docs/westhampton_quogue_group_level_blood_testing
- https://www.cdc.gov/exposurereport/pdf/FourthReport_UpdatedTables_Volume1_Jan2019-508.pdf
- https://www.health.ny.gov/environmental/investigations/newburgh/docs/infosheetgroupresults.pdf

