Geospatial Research, Analysis, and Services Program (GRASP)

GRASP provides CDC with the expertise to develop, update, and power the COVID-19 Data Tracker, as well as a CDC/ATSDR Social Vulnerability Index to identify areas where people may be at higher risk of COVID-19 infection.
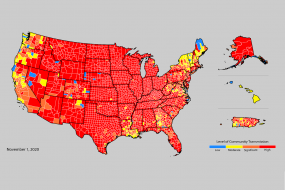
The Geospatial Research, Analysis, and Services Program (GRASP) collaborated and engaged with multiple stakeholders across CDC, ATSDR, and beyond to empower national and local COVID-19 response efforts. One example of this work is the CDC’s central dashboard of publicly available COVID-19 data, the CDC COVID-19 Data Tracker, created and deployed by GRASP. Since March 2020, GRASP has provided geospatial expertise to design, develop, and manage this dashboard of key, daily updated COVID-19 data and related visualizations including cases, deaths, testing numbers, demographics, and vaccination and hospitalization trends. New data tabs have been added every week to address the ongoing needs of CDC’s COVID-19 response team.
GRASP also has leveraged the CDC/ATSDR Social Vulnerability Index (CDC/ATSDR SVI) to help communities at higher risk of COVID-19 infection access vaccination and testing.
What is the CDC/ATSDR Social Vulnerability Index (CDC/ATSDR SVI)?
A community’s social vulnerability plays a vital role in its preparedness for, response to, and recovery from hazardous events like a disaster or disease outbreak. Social vulnerability refers to the demographic and socioeconomic factors contributing to specific communities being harmed and affected more by public health emergencies than others. The CDC/ATSDR SVI helps officials identify the locations of the most socially vulnerable populations in the United States. The CDC/ATSDR SVI comprises Census Bureau data on variables like poverty status, unemployment rates, age, disability status, racial/ethnic minority status, and more.
Throughout the pandemic, scientists and public health officials have used the CDC/ATSDR SVI to identify and support communities across the country disproportionally affected by COVID-19.
The CDC/ATSDR SVI has been used to
Collaborate with the Massachusetts Department of Public Health to identify COVID-19 testing disparities
Partner with the HHS Office of Minority Health to explore and characterize the disproportionate effects of the COVID-19 pandemic on racial/ethnic minority communities. This preliminary work resulted in a 3-year, $3M collaborative partnership to use geospatial science and technology to examine and quantify COVID-19 health effects on minority communities across the United States
Collaborate with the Office of the Surgeon General to identify communities at increased risk for COVID-19 that were candidates for drive-through, community-based testing locations. This effort helped establish an additional 240 COVID-19 testing locations in 33 states, 69% of which were placed in communities with moderate to high social vulnerability, as measured by CDC/ATSDR SVI
The National Academies of Science, Engineering, and Medicine recommended that local and federal public health officials rely on the CDC/ATSDR SVI databases to inform efforts to allocate, distribute, and administer the COVID-19 vaccine in communities at increased risk for COVID-19. In addition, scientists from the National Institute of Environmental Health Sciences, North Carolina State University, and Texas A&M University developed the COVID-19 Pandemic Vulnerability Index, including several CDC/ATSDR SVI components.