At a glance
This is the 508 compliant page for the NCEH Extreme Heat Adaptation Story Map. Please see the link below.
Extreme heat adaptation story map
Dive into the Extreme Heat Adaptation Story Map!
How the Climate-Ready States and Cities Initiative (CRSCI) grant recipients are preparing for and responding to increasing temperatures
Emmanuelle Hines (ORISE), Climate and Health Program, Centers for Disease Control and Prevention
CDC’s Climate and Health Program is the national leader in empowering communities to protect human health from a changing climate. We do this through three core strategies: building the evidence base, expanding capacity, and telling the story.
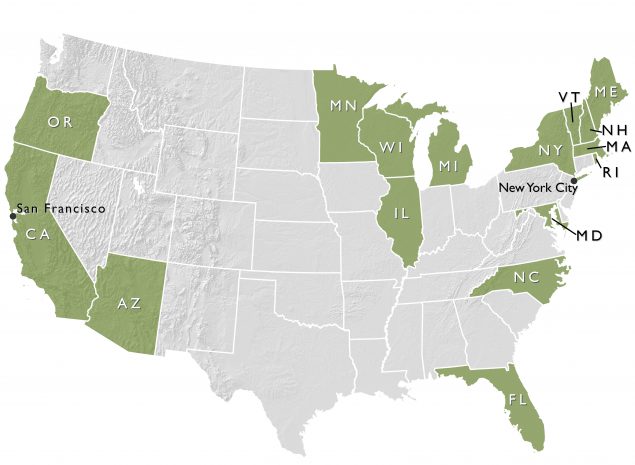
CDC is using its public health expertise to help state and city health departments prepare for and respond to the health effects that climate change brings to their communities. CDC's Climate-Ready States and Cities Initiative (CRSCI) is helping grant recipients from 16 states (California, Oregon, Arizona, Minnesota, Wisconsin, Illinois, Michigan, Florida, North Carolina, Maryland, New York, Rhode Island, Massachusetts, New Hampshire, and Maine) and two cities (San Francisco and New York City) use the five-step Building Resilience Against Climate Effects (BRACE) framework to identify likely climate impacts in their communities, potential health effects associated with these impacts, and their most at-risk populations and locations. The BRACE framework then helps states develop and implement health adaptation plans and address gaps in critical public health functions and services.
Extreme heat and heat-related illnesses
Extreme heat events have long threatened public health in the United States. Many cities, including St. Louis, Philadelphia, Chicago, and Cincinnati, have suffered increases in death rates during heat waves. Deaths result from heat stroke and related conditions, but also from heart disease, respiratory disease, stroke, and kidney disorders. Heat waves are also associated with increased hospital admissions these health conditions. Extreme summer heat is increasing in the United States, and climate projections indicate that extreme heat events will be more frequent and intense in coming decades.
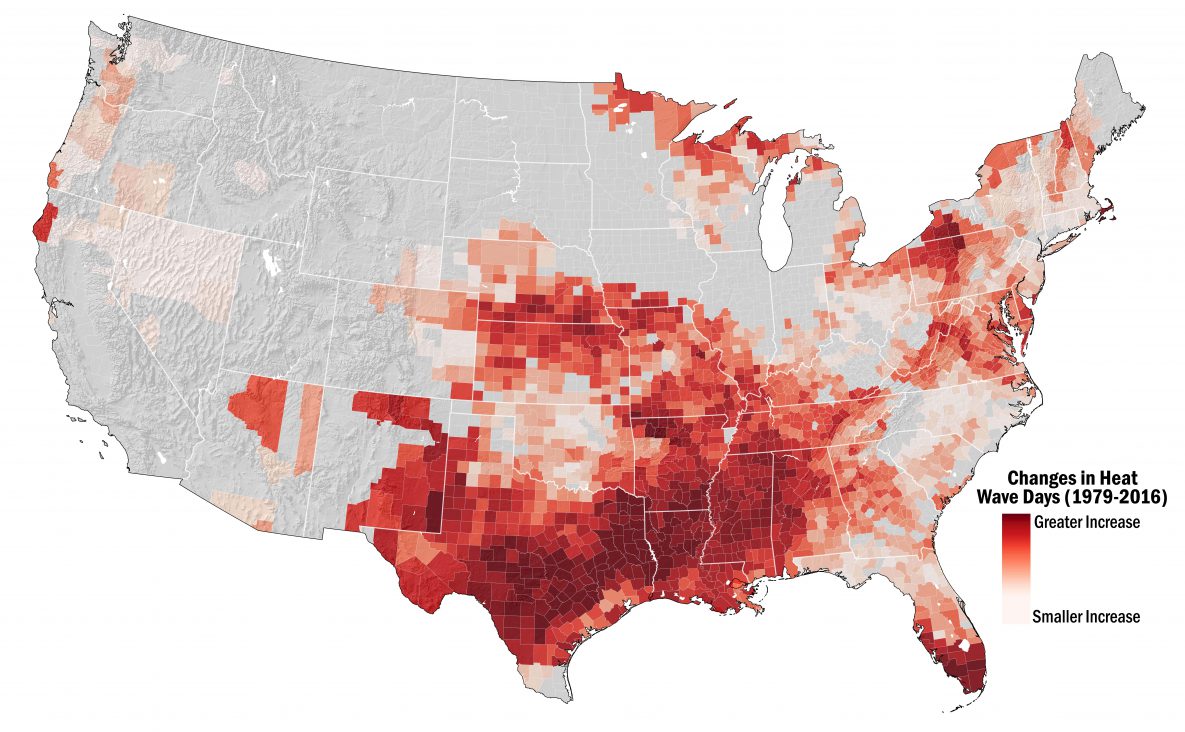
Text Description of Map: This map of U.S. counties represents the change in the number of heat wave days per year, over a 38-year period (1979-2016). Counties in dark red exhibited the greatest increase in the number of heat wave days, as compared to counties in light red. Counties in gray did not exhibit a statistically significant change (p-value < 0.05) in the number of heat wave days. Regional trends in heat wave days are apparent in the map. In particular, the Southern Great Plains and Southeast regions of the U.S. have experienced the greatest increases in the number of heat wave days over the 38-year period, as have some areas of the Southwest, Northeast, and Midwest regions. Many of the states in the Western US, as well as those in the Northern Great Plains region have not experienced significant changes in heat wave days.
Extreme heat adaptation
Extreme heat events are a cause of preventable death nationwide and many of the CRSCI grant recipients have identified heat as one of their top threats. In response, CRSCI grant recipients have undertaken a wide variety of adaptation activities to help health departments and their partners better prepare for and respond to extreme heat events in their jurisdictions.
This StoryMap will present examples of these heat adaptation activities across the 18 CRSCI grant recipients, organized into the following categories: 1) Adaptation and Response Plans, 2) Communications and Education Activities, 3) Heat Health Alert Systems, 4) Cooling Centers and Water Sites, 5) Home Energy Assistance and Weatherization, 6) Surveillance, 7) Assessments and Analyses, 8) Data and Tools, and 9) Partnerships and Collaborations.
1) Adaptation and response plans
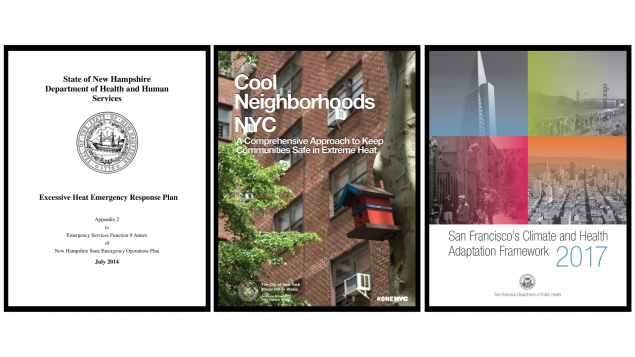
CRSCI grant recipients were required to create a Climate and Health Adaptation Plan for their jurisdiction, outlining the priorities, activities, resources, stakeholders, and responsibilities required to reduce the anticipated negative health effects resulting from climate and health hazards. Most CRSCI grant recipients' adaptation plans address long-term extreme heat trends and related adaptation strategies, since extreme heat events are projected to become more frequent and intense over the next decade.
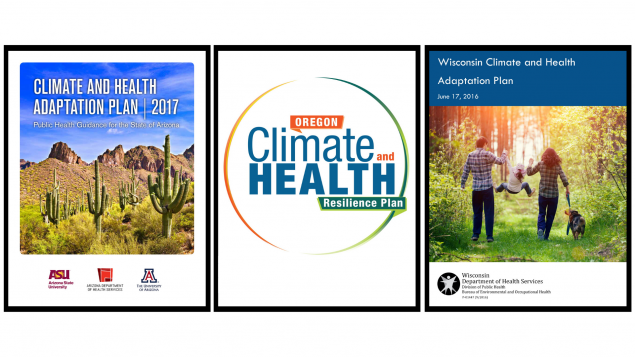
For example, the Arizona Extreme Weather and Public Health Program released a Climate and Health Adaptation Plan in 2017 and an Addendum in 2018, which provide an organizing framework as well as a platform for discussion on the most effective strategies to benefit health and the challenges in climate adaptation.
Some CRSCI grant recipients have additionally created heat response plans, which primarily guide government agencies and partners through emergency response activities to prevent heat-related morbidity and mortality during extreme heat events. A heat response plan may be a stand-alone plan or an annex to an all-hazards plan depending on your jurisdiction.
For example, the New Hampshire Department of Health and Human Service created an Excessive Heat Emergency Response Plan which includes information on response roles, thresholds for response activation, associated health risks, activities by heat emergency phase, criteria for cooling centers, and templates for press releases and health alert messages.
For more information on heat response plans, please see the Climate and Health Program's BRACE Technical Report titled "Heat Response Plans: Summary of Evidence and Strategies for Collaboration and Implementation."
2) Communications and education activities
Communications
A communication strategy is an integral part of a heat response plan. Health departments can use various types of communication methods to reach the most at-risk populations, as well as critical partners and community organizations, during an extreme heat event.Communi
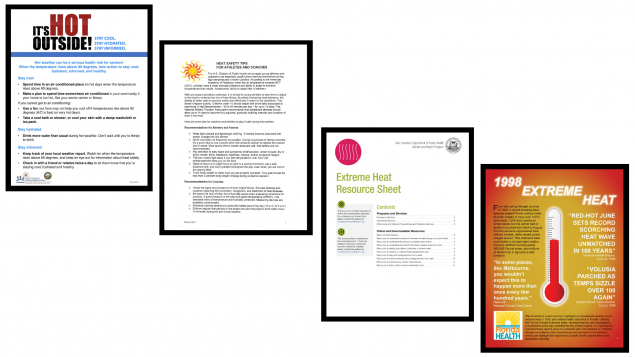
The CRSCI grant recipients have created a wealth of communications materials for different audiences.
- The San Francisco Climate and Health Program created an extreme heat resource page for healthcare professionals.
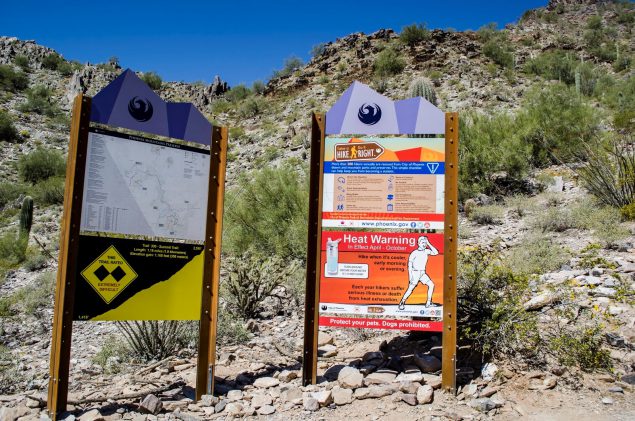
- In Arizona, several Phoenix city departments partnered to develop consistent messaging about hiking safety and install new heat safety signs at Phoenix trailheads to inform hikers of health risks.
- The North Carolina Division of Public Health produced a tip sheet with heat safety recommendations for athletes, coaches, and parents.
- The New Hampshire Climate and Health Program created a heat safety flyer for older adults.
- The Florida BRACE Program wrote a fact sheet on the 1998 Extreme Heat Touchstone Event to highlight the importance of public health preparedness and adaptation planning.
Education
In addition to communications strategies, many health departments develop trainings and other formal educational activities geared toward a variety of audiences. These educational activities serve as opportunities to improve a community's resilience to extreme heat events by increasing their awareness of heat's negative health impacts and promoting strategies to reduce their risk through adaptation.
Many CRSCI grant recipients have developed trainings and educational activities about heat.
- BRACE-Illinois provided a training to migrant farmworker promotores (community health workers) on heat illness and climate change.
- BRACE-Illinois also developed continuing medical education (CME) approved webinar that included large sections on heat stress for the Illinois Chapter of the Academy of American Pediatricians and the Illinois Academy of Family Physicians.
- The Maryland Climate Change Health Adaptation Program developed two 8th grade educational modules on climate and health.
- The Minnesota Climate & Health Program created a video on extreme heat events as part of a training module series.
3) Heat health alert systems
In addition to the communications and education activities, health departments can use heat health alert systems to provide timely messages tailored to groups of people who might be affected by excessive heat. Heat health alert systems might include public service announcements, email and text message alerts, TV and radio coverage, websites, or social media platforms such as Facebook and Twitter. To reduce language barriers in at-risk populations, jurisdictions can consider translating materials to reach these affected populations.
The Arizona Department of Health Services offers an opt-in email or text subscription service through which residents can receive heat alerts for the general public or specifically for schools.
North Carolina's Department of Health and Human Services implements heat-health alert systems targeted to farm workers, low-income earners, older adults receiving nutritional assistance, and youth using county parks and recreation in southeastern North Carolina. The systems lower the alert temperature threshold from National Weather Service heat advisory levels of 105°F to 100°F. Alerts are communicated through farm worker health trainings, an information campaign with a local housing authority, nutritional assistance site staff trainings, and parks and recreation staff trainings.
When a heat advisory was issued by the National Weather Service for the Rhode Island area, the Rhode Island Department of Health issued a Heat Health Alert to an email list of Licensed Primary Care Providers (~1,760 recipients). The email provided information about the health risks associated with extreme heat and the populations most at-risk, and asked providers to take actions such as instruct at-risk patients to use home air conditioners or go to air-conditioned places and to stay well-hydrated.
4) Cooling centers and water sites
A cooling center is a location, typically an air-conditioned or cooled building, that has been designated as a site to provide respite and safety during extreme heat. This may be a government-owned building such as a library or school, an existing community center, religious center, recreation center, community pool, or a private business such as a coffee shop, shopping mall, or movie theatre. Sometimes temporary cool spaces are constructed for events such as a marathon or outdoor concert. They may be operated by a health department, city government, non-profit groups, or a combination of agencies and/or partners. Cooling centers also often distribute water bottles to prevent dehydration in those exposed to high temperatures.
Many CRSCI grant recipients have helped facilitate the creation of cooling centers in their jurisdictions.
Map of Cooling Centers by location. Click to view live content.
- Due to frequent triple digit temperatures during the summer months, several Arizona counties, including Maricopa, Pinal, Yuma, and Pima Counties, have established heat relief networks of cooling centers and hydration stations.
- Although other CRSCI grant recipients face less extreme temperatures than Arizona, rising summer temperatures have necessitated the creation of cooling centers in jurisdictions including Illinois, Ramsey County and Hennepin County in Minnesota, New York State and New York City.
- On a smaller scale, through a Rhode Island Department of Health mini-grant to Smithfield Emergency Management Agency, Smithfield was able to purchase supplies to establish an emergency portable cooling center and misting tent.
For more information on cooling centers, please see the Climate and Health Program's BRACE Technical Report titled "The Use of Cooling Centers to Prevent Heat-Related Illness: Summary of Evidence and Strategies for Implementation."
5) Home energy assistance and weatherization
Some jurisdictions offer energy assistance programs to help people pay for their electricity bills when temperatures become extremely high. These programs might allow qualified households (disabled, seniors, low income, specific medical condition) to continue to use their air conditioners, given that cost can be a major factor when considering air conditioner use. Some energy assistance programs establish agreements with utility companies to avoid shutting off power during periods of extreme heat, and loan or give air conditioning units or fans to homes in need.
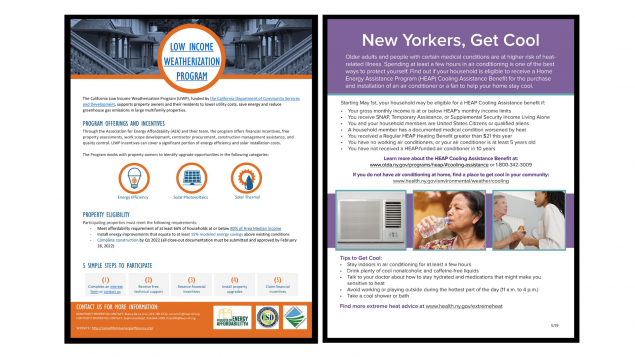
CRSCI grant recipients participating in energy assistance programs include Arizona's Low Income Home Energy Assistance Program (LIHEAP), New York State's Heat and Cooling Assistance Program (HEAP), and California's Low Income Home Energy Assistance Program (LIHEAP)
Similarly, some jurisdictions offer home weatherization programs, which support homeowners in the installation of energy efficiency measures that also lower utility bills, reduce greenhouse gas emissions, and resolve health & safety issues. Weatherization may include sealing the building shell, repairing and/or replacing heating, cooling, and water heating systems, and replacing lighting, appliances, and water fixtures.

CRSCI grant recipients participating in weatherization programs include Arizona's Weatherization Program (ADOH WAP), California's Low Income Weatherization Program (LiWP), and Vermont's Weatherization Assistance Program (VT WAP).
6) Surveillance
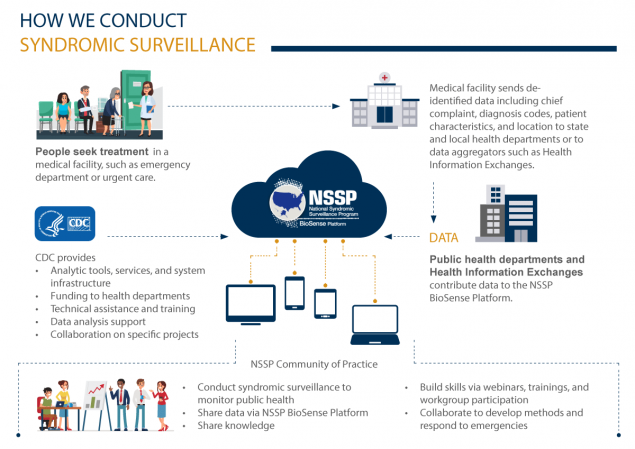
Text Description of Infographic: The NSSP is a collaboration among CDC, federal partners, local and state health departments, and academic and private sector partners. They collect, analyze, and share electronic patient encounter data received from emergency departments, urgent and ambulatory care centers, inpatient healthcare settings, and laboratories. The electronic health data are integrated through a shared platform—the BioSense Platform. The public health community uses analytic tools on the platform to analyze data received within 24 hours of patient visits to participating facilities. These timely and actionable data are used to detect, characterize, monitor, and respond to events of public health concern, such as extreme heat events.
Some health departments use a technique called surveillance to track and analyze data on indicators of heat-related illness and death, such as heat-related ER visits, Emergency Medical Services (EMS) activity, and death certificate data. Surveillance data can be useful in describing at-risk populations and risk factors within a community, determining targeted interventions, properly timing public health messaging, and managing EMS and hospital staffing to react to medical surge of heat cases.
In Arizona, Maricopa County and Pinal County conduct surveillance using the existing National Syndromic Surveillance Program (NSSP) BioSense Platform and the Electronic Surveillance System for Early Notification of Community-based Epidemics (ESSENCE).
The North Carolina Department of Public Health created their own surveillance system called the North Carolina Disease Event Tracking and Epidemiologic Collection Tool (NC DETECT) in collaboration with the Carolina Center for Health Informatics (CCHI).
The Oregon Climate and Health Program has partnered with the state's Preparedness, Surveillance, and Epidemiology team to summarize surveillance data during heat waves and share the information with media, community partners, and in technical reports, which indicate a significant spike in ER visits during days with abnormal extreme heat.
7) Assessments and analyses
Since more frequent and extreme heat events are projected across the United States, many CRSCI grant recipients have examined the impacts of heat on human health in their communities and used this information to inform recommendations that will improve health outcomes.
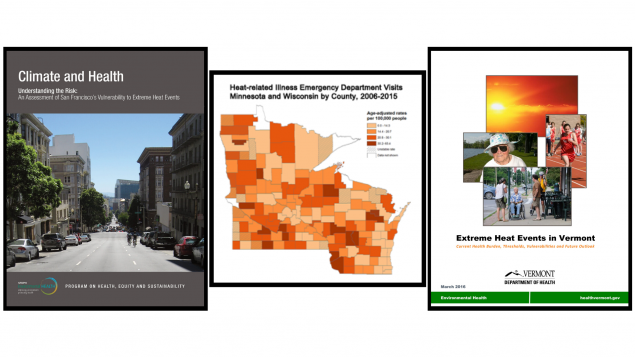
- The Minnesota and Wisconsin Climate and Health Programs collaborated to analyze heat-related illnesses and population vulnerability at the county level across the two states.
- The Massachusetts Department of Health conducted an assessment of the health impacts and benefits of regional climate action plan strategies in western Massachusetts.
- The Wisconsin Climate and Health Program used the Community Assessment for Public Health Emergency Response (CASPER) model to assess household use of adaptation to heat (e.g., air conditioning), household vulnerabilities to heat (e.g., outdoor workers), methods of communication regarding heat events, and used the results to improve policies and procedures to mitigate heat-related health impacts.
8) Data and tools
In addition to publishing assessments and analyses, several CRSCI grant recipients have made their climate and health vulnerability data available to the public. Through the development of a variety of user-friendly tools for sharing and visualizing information, local and state health departments, as well as concerned residents in these jurisdictions, can use the tools to identify communities at risk of harm from extreme heat and plan to meet their needs.
- Some CRSCI grant recipients, like CALBRACE, have produced their own interactive data visualization platforms. CALBRACE developed CCHVI to display the Climate Change & Health Vulnerability Indicators for California (CCHVIs), which include many heat-relevant indicators on environmental exposures, population sensitivity, and adaptive capacity measures.
- Other CRSCI grant recipients, like the Vermont Climate & Health Program have used existing online mapping platforms to create interactive heat vulnerability maps.
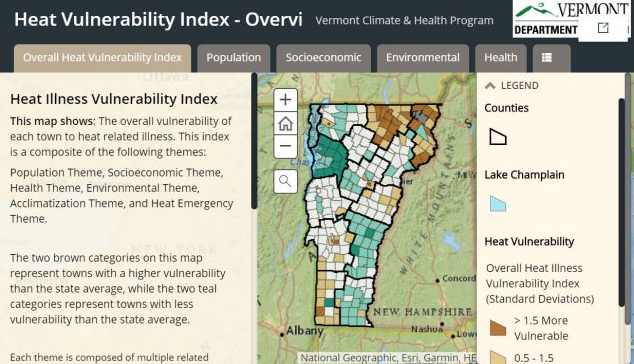
Health Vulnerability Indicators for California. Click to view live content.
Two CRSCI grant recipients have also used ArcGIS StoryMaps as a visualization and storytelling tool.
- The Rhode Island Department of Health created a StoryMap to map the Rhode Island Health Equity Measures, which include 15 determinants of health in five domains that affect health equity.
- The San Francisco Climate and Health Program created a StoryMap illustrating a recent assessment of San Francisco's vulnerability to the health impacts of extreme heat.
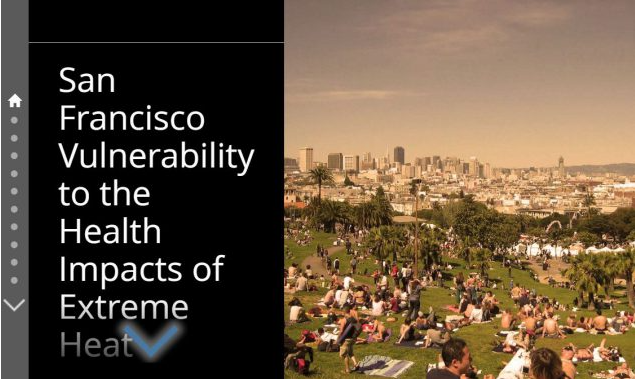
San Francisco Climate and Health Program. Click to view live content.
9) Partnerships and collaboration
State, local, and tribal health departments are widely trusted and play a central role in helping communities prepare for and respond to the health impacts of climate change.
Many sectors outside of public health are already engaging in community climate adaptation, and there is growing recognition of the need to address health impacts as part of this work. As a result, many sectors are ready and willing to collaborate with health departments if asked.
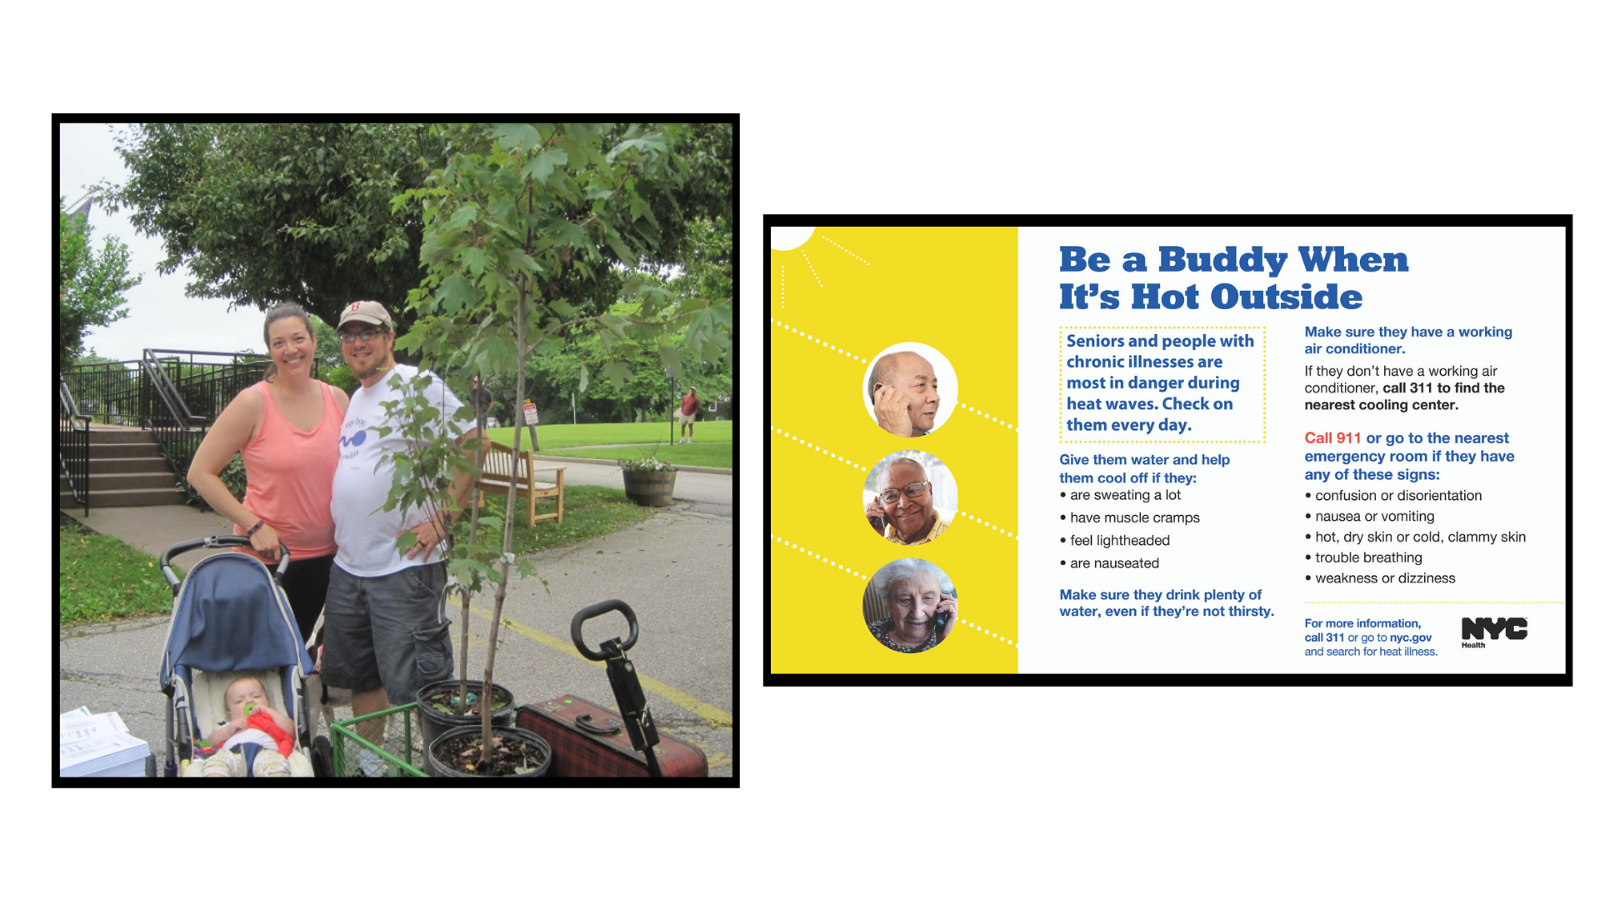
New York City launched Be a Buddy, a two-year pilot program, to foster buddy systems between social service and community organizations, volunteers, and at-risk New Yorkers, to be deployed during emergencies to conduct telephone and, if necessary, door-to-door and building level checks on at-risk individuals. Be a Buddy NYC implemented protective measures against heat-related illnesses by: (1) training community organizations and volunteers on emergency protective measures and ways to assist at-risk adults; and (2) engaging communities to identify alternative neighborhood resources for staying cool and to communicate protective health messages to hard-to-reach populations via trusted messengers.
The Vermont Climate and Health Program, in partnership with the Arbor Day Foundation and the Vermont Urban & Community Forestry Program, co-sponsor an annual Community Canopy program targeted towards urban communities at relatively high risk for heat illnesses. Between 2017-2019, Energy Saving Trees provided residents with hundreds of that are expected to create cool environments, increase energy savings, reduce atmospheric carbon, remove air pollutants, and intercept stormwater, with an estimated economic benefit of $50,000.
Closing information
For more information about the Climate Ready States and Cities Initiative (CRSCI), please contact the Climate and Health Program.
Climate-Ready States and Cities Initiative | CDC
CDC is using its public health expertise to help state and city health departments prepare for and respond to the health effects that a changing climate may bring to their communities. Likely impacts include increased extreme weather events, wildfires, decreased air quality, and illnesses transmitted by food, water, and disease carriers such as mosquitoes and ticks.
Temperature Extremes | CDC
Extreme heat events have long threatened public health in the United States. Many cities, including St. Louis, Philadelphia, Chicago, and Cincinnati, have suffered dramatic increases in death rates during heat waves. Deaths result from heat stroke and related conditions, but also from cardiovascular disease, respiratory disease, and cerebrovascular disease.
Centers for Disease Control and Prevention: Temperature Extremes
Extreme Heat | CDC
Heat-related deaths and illnesses are preventable. Despite this fact, more than 600 people in the United States are killed by extreme heat every year. This website provides helpful tips, information, and resources to help you stay safe in the extreme heat this summer.
Tracking Heat | CDC
Extremely hot weather can make you sick. Stay cool and hydrated to protect yourself. The Tracking Network provides data and tools that you can use to see how extreme heat may affect your health. CDC's Environmental Public Health Tracking Network (Tracking Network) is a dynamic surveillance system that provides information and data about environmental hazards and the health problems that may be related to them.
Centers for Disease Control and prevention: Tracking Network in Action
National Integrated Heat Health Information System (NIHHIS)
NIHHIS helps decision makers prepare for extreme heat events days, months, and years in the future.

