Environmental Justice Index at the State and Local Level

Find out how the Environmental Justice Index (EJI) can provide a valuable national perspective to local or regional environmental justice challenges. Explore the EJI today at eji.cdc.gov.
Environmental justice is achieved when everyone enjoys the same degree of protection from environmental and health hazards and has equal access to the decision-making process to function in a healthy environment. The EJI helps public health officials identify and prioritize communities most at risk for the health impacts of environmental burden. The EJI is the first national, place-based tool designed to measure the cumulative impacts of environmental burdens through the lens of human health and health equity.
This document outlines examples of how public health officials and others have used the EJI, offers a supplemental approach to identifying and mapping areas most at risk for environmental health impacts, and provides definitions for three environmental justice tools. This information is intended to help you to use the EJI to promote environmental justice and health equity at the state and local level.
EJI Uses
The EJI can be used to
- identify and prioritize areas that may require special attention or additional action in order to improve health and health equity,
- educate and inform the public about the environmental burdens in their community to inspire and empower community-driven action,
- analyze the unique, local factors driving cumulative impacts on health to inform policy and decision-making, and
- establish meaningful goals and measure progress towards environmental justice and health equity.
The EJI may also serve as a framework to develop new tools in states where environmental justice mapping and screening tools have yet to be developed.
EJI Use Examples
The EJI can provide a valuable national perspective to local or regional environmental justice challenges. EJI brings attention to the scope of an issue and enables broad geographic comparisons.
New York Tolling Plan Environmental Assessment
The New York Metropolitan Transit Authority (NY MTA) used the EJI to analyze the potential effects of a Central Business District Tolling Alternative on low-income and minority populations in New York and New Jersey. Following a U.S. Department of Health and Human Services [PDF – 1 MB] (HHS) recommendation, NY MTA used the EJI and other environmental justice mapping tools to identify communities with pre-existing pollution and chronic disease burdens. NY MTA prioritized these communities for the implementation of several health protective measures recommended by HHS.
Chesapeake Bay Report Card
The University of Maryland Center for Environmental Science (UMCES) recently integrated the EJI into their 2023 Chesapeake Bay Eco Health Report Card. The EJI enabled UMCES to compare tracts across multiple states within the Chesapeake Bay watershed. The UMCES Chesapeake Bay Report summarizes disparities among the watersheds’ urban, suburban, and rural communities UMCES asserts that addressing environmental justice is crucial for the long-term health and sustainability of the Chesapeake Bay watershed.
A Supplemental Approach to Environmental Justice
The EJI uses nationally consistent data to build upon environmental justice screening and mapping tools that have previously been developed at the state and federal levels. The EJI is not intended as a replacement for state and federal tools; however, it may serve as a useful supplement to such tools by
- providing national-level comparisons that may bring additional attention to local issues,
- focusing on the cumulative impacts of environmental burdens on health, and
- serving as additional validation of the lived experiences of communities impacted by poor environmental conditions and other social determinants of health.
The EJI Compared to Existing Tools
Most environmental justice mapping and screening tools have a similar objective: to assist in identifying communities with existing or potential environmental justice concerns to help highlight and address injustices. However, there is no single method to accomplish this goal. Each approach involves unique considerations and trade-offs that determine proper use and interpretation.
Broadly speaking, most environmental justice mapping and screening tools can be broken into three categories: percentile-based tools, threshold-based tools, and direct data tools. The EJI is an example of a percentile-based tool. EJI 2022 Technical Documentation [PDF – 1.5 MB] has a complete description of EJI methodology. Please review it to learn how the EJI compares to other percentile-based tools.
Types of Environmental Justice Tools
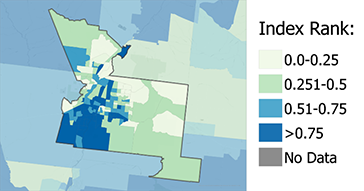
Percentile-Based Tools
Percentile-based tools present relative rankings and compare areas to each other based on individual or combined measures of environmental, social, or health factors. Some percentile-based tools use explicit or implicit thresholds as well. Percentile-based tools aim to help users easily combine and interpret data.
Threshold-Based Tools
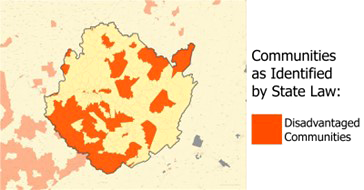
Threshold-based tools take raw data or processed data and apply a single threshold. Above the threshold, an area is characterized as “disadvantaged” or an “environmental justice community.” Thresholds are often tied to laws or regulations.
Direct Data Tools
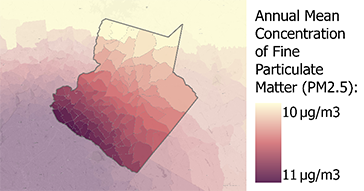
Direct data tools allow users to view data in their raw form. For example, the percentage of a population in poverty or the concentration of fine particulate matter. Direct data tools don’t provide users with any standards or comparisons to inform decision-making.
- Visit the EJI online at eji.cdc.gov.
- Contact the EJI Coordinator at eji_coordinator@cdc.gov.
- Send media inquiries to placeandhealth@cdc.gov.
